Measured from source
Sistum reads your files and your repositories. Nothing is typed in by hand, except what you choose to add.
Sistum analyzes your design and code, scores them, and tells you what to fix next.
You are on the list. We will email you when the beta opens.
Works with the tools your team already uses
Why Sistum
A health check for design systems. It reads your Figma libraries and your code, so the number is measured and not guessed, and it tells you what to fix next.
Sistum reads your files and your repositories. Nothing is typed in by hand, except what you choose to add.
Every refresh ends with what to fix first, with the evidence behind each item.
The score is versioned and explained, so you can check the arithmetic yourself.
Instant reading
Paste the address of a public repository. No account, no setup. You get a partial reading of the metrics that can be read from public code.
Example reading
Read from the public repository. Connect Figma and your product repositories to unlock the full Sistum score.
What you get
Ten things Sistum does better than a spreadsheet, and the extras that come with them.
01 / Score
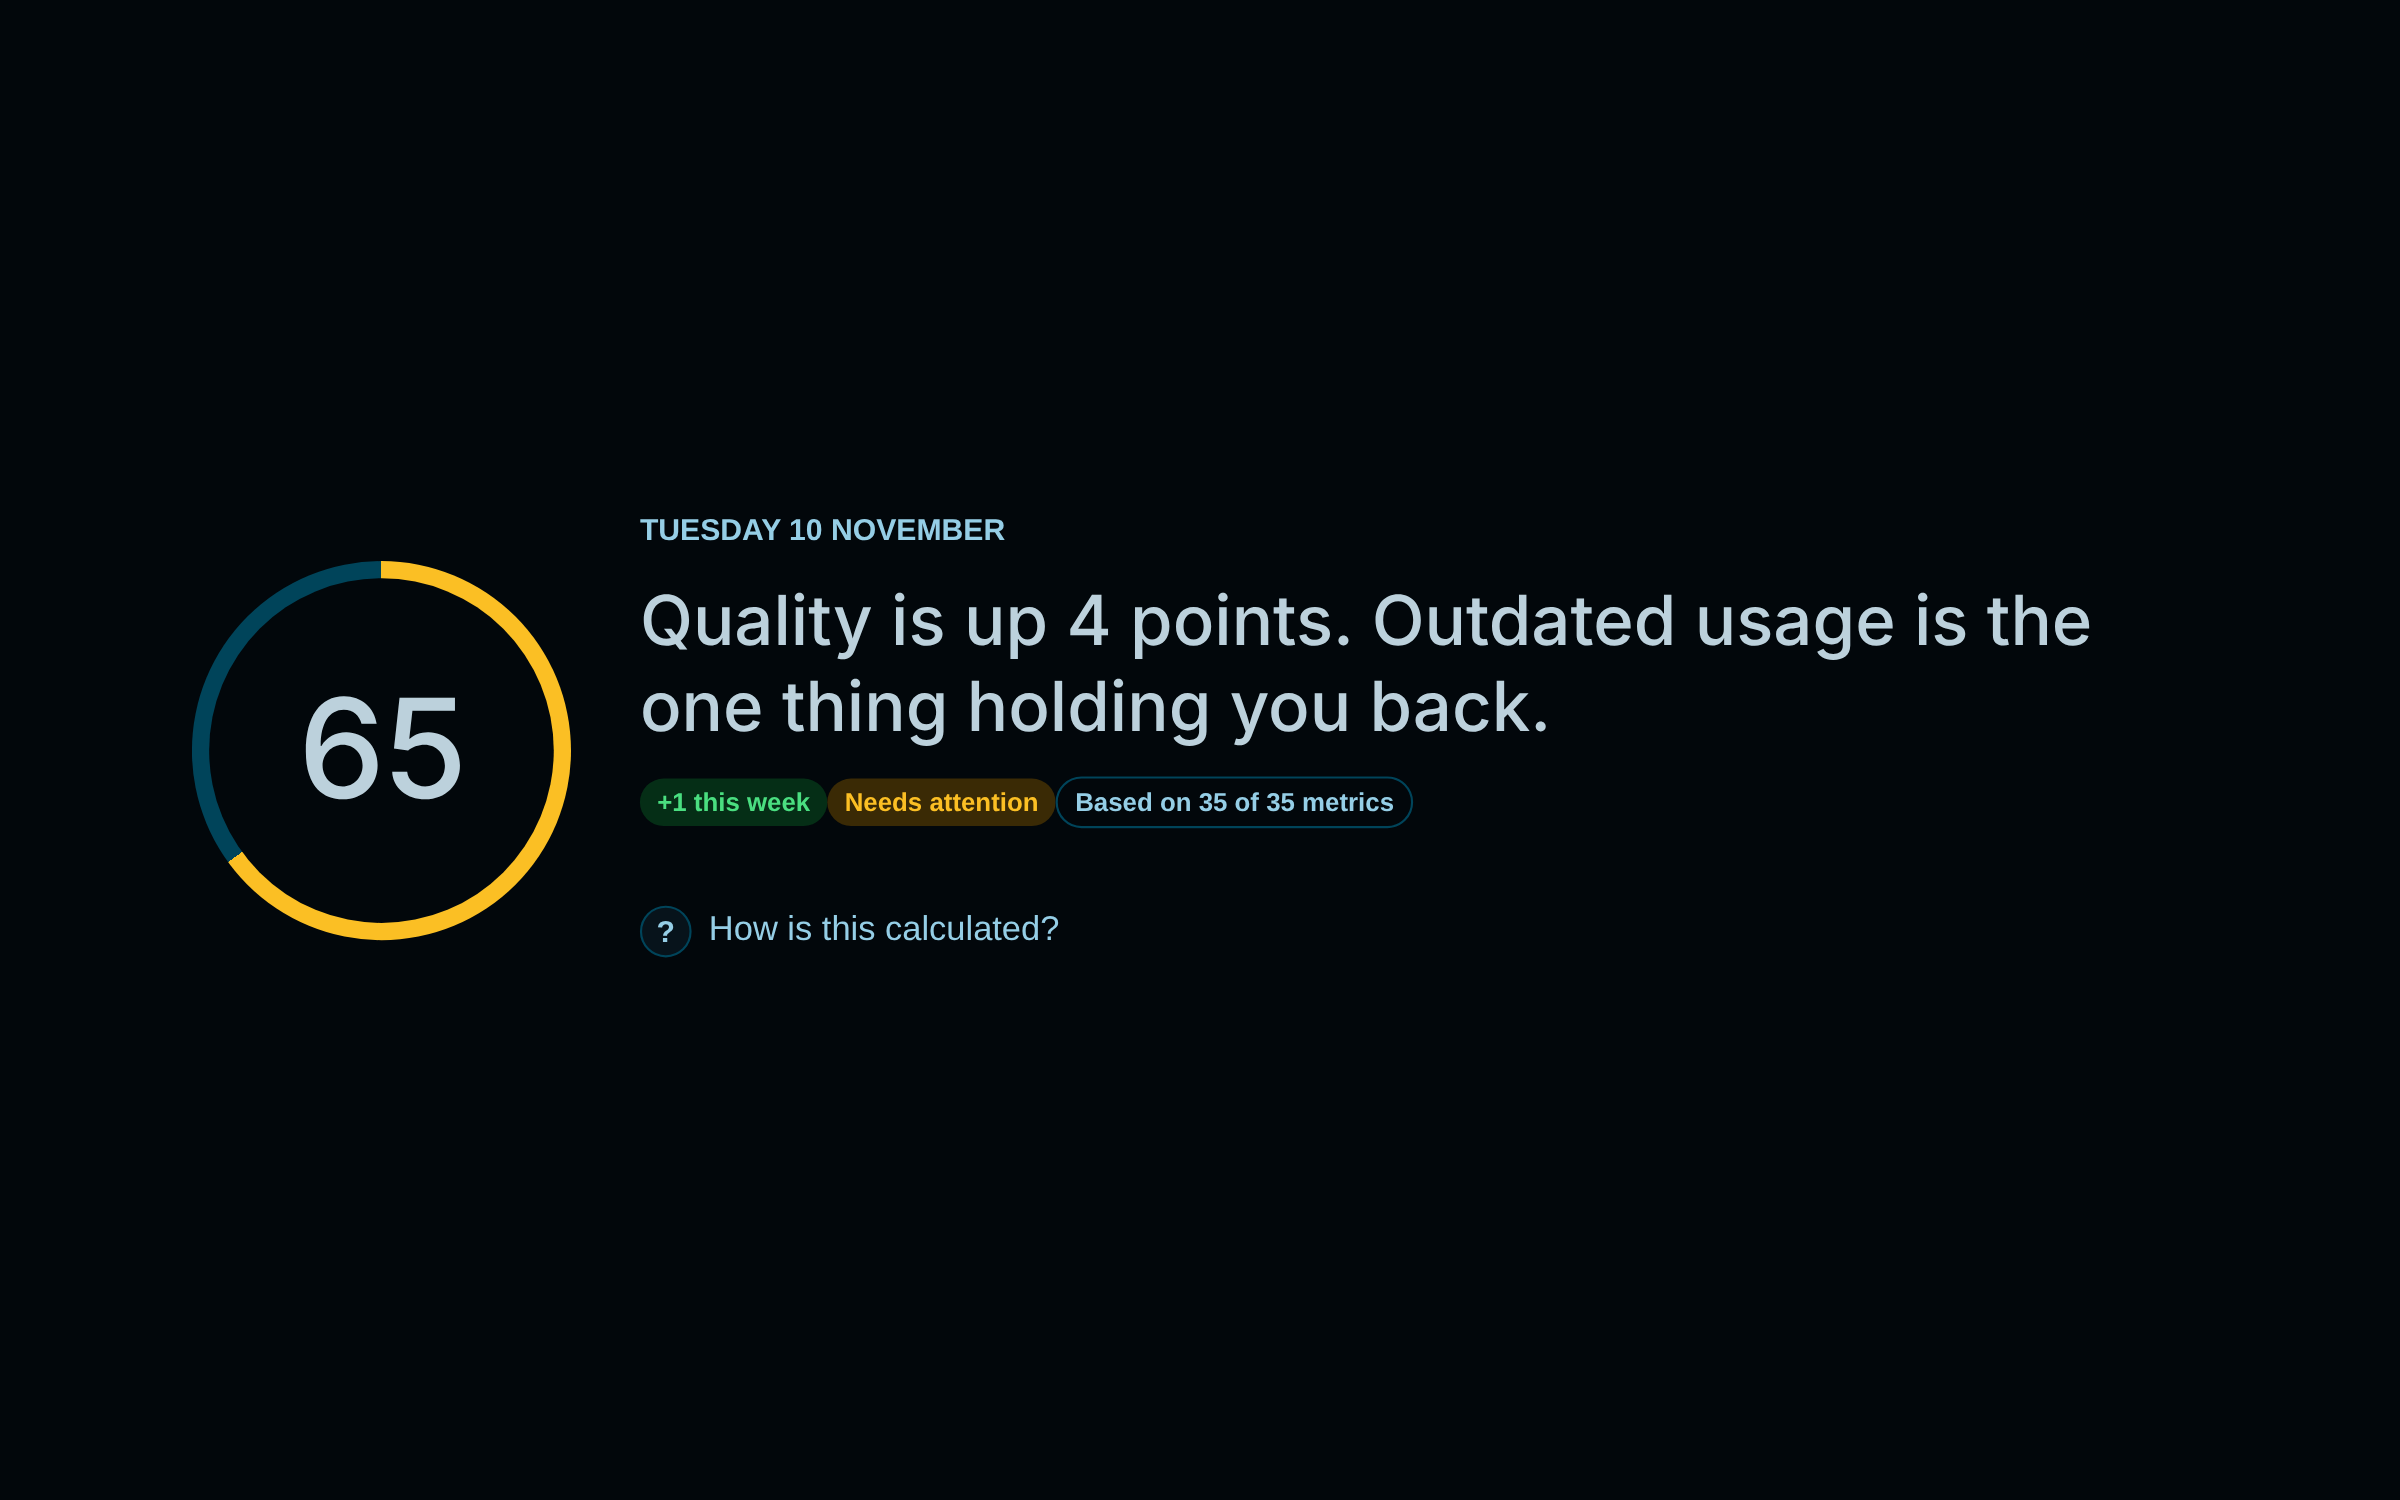
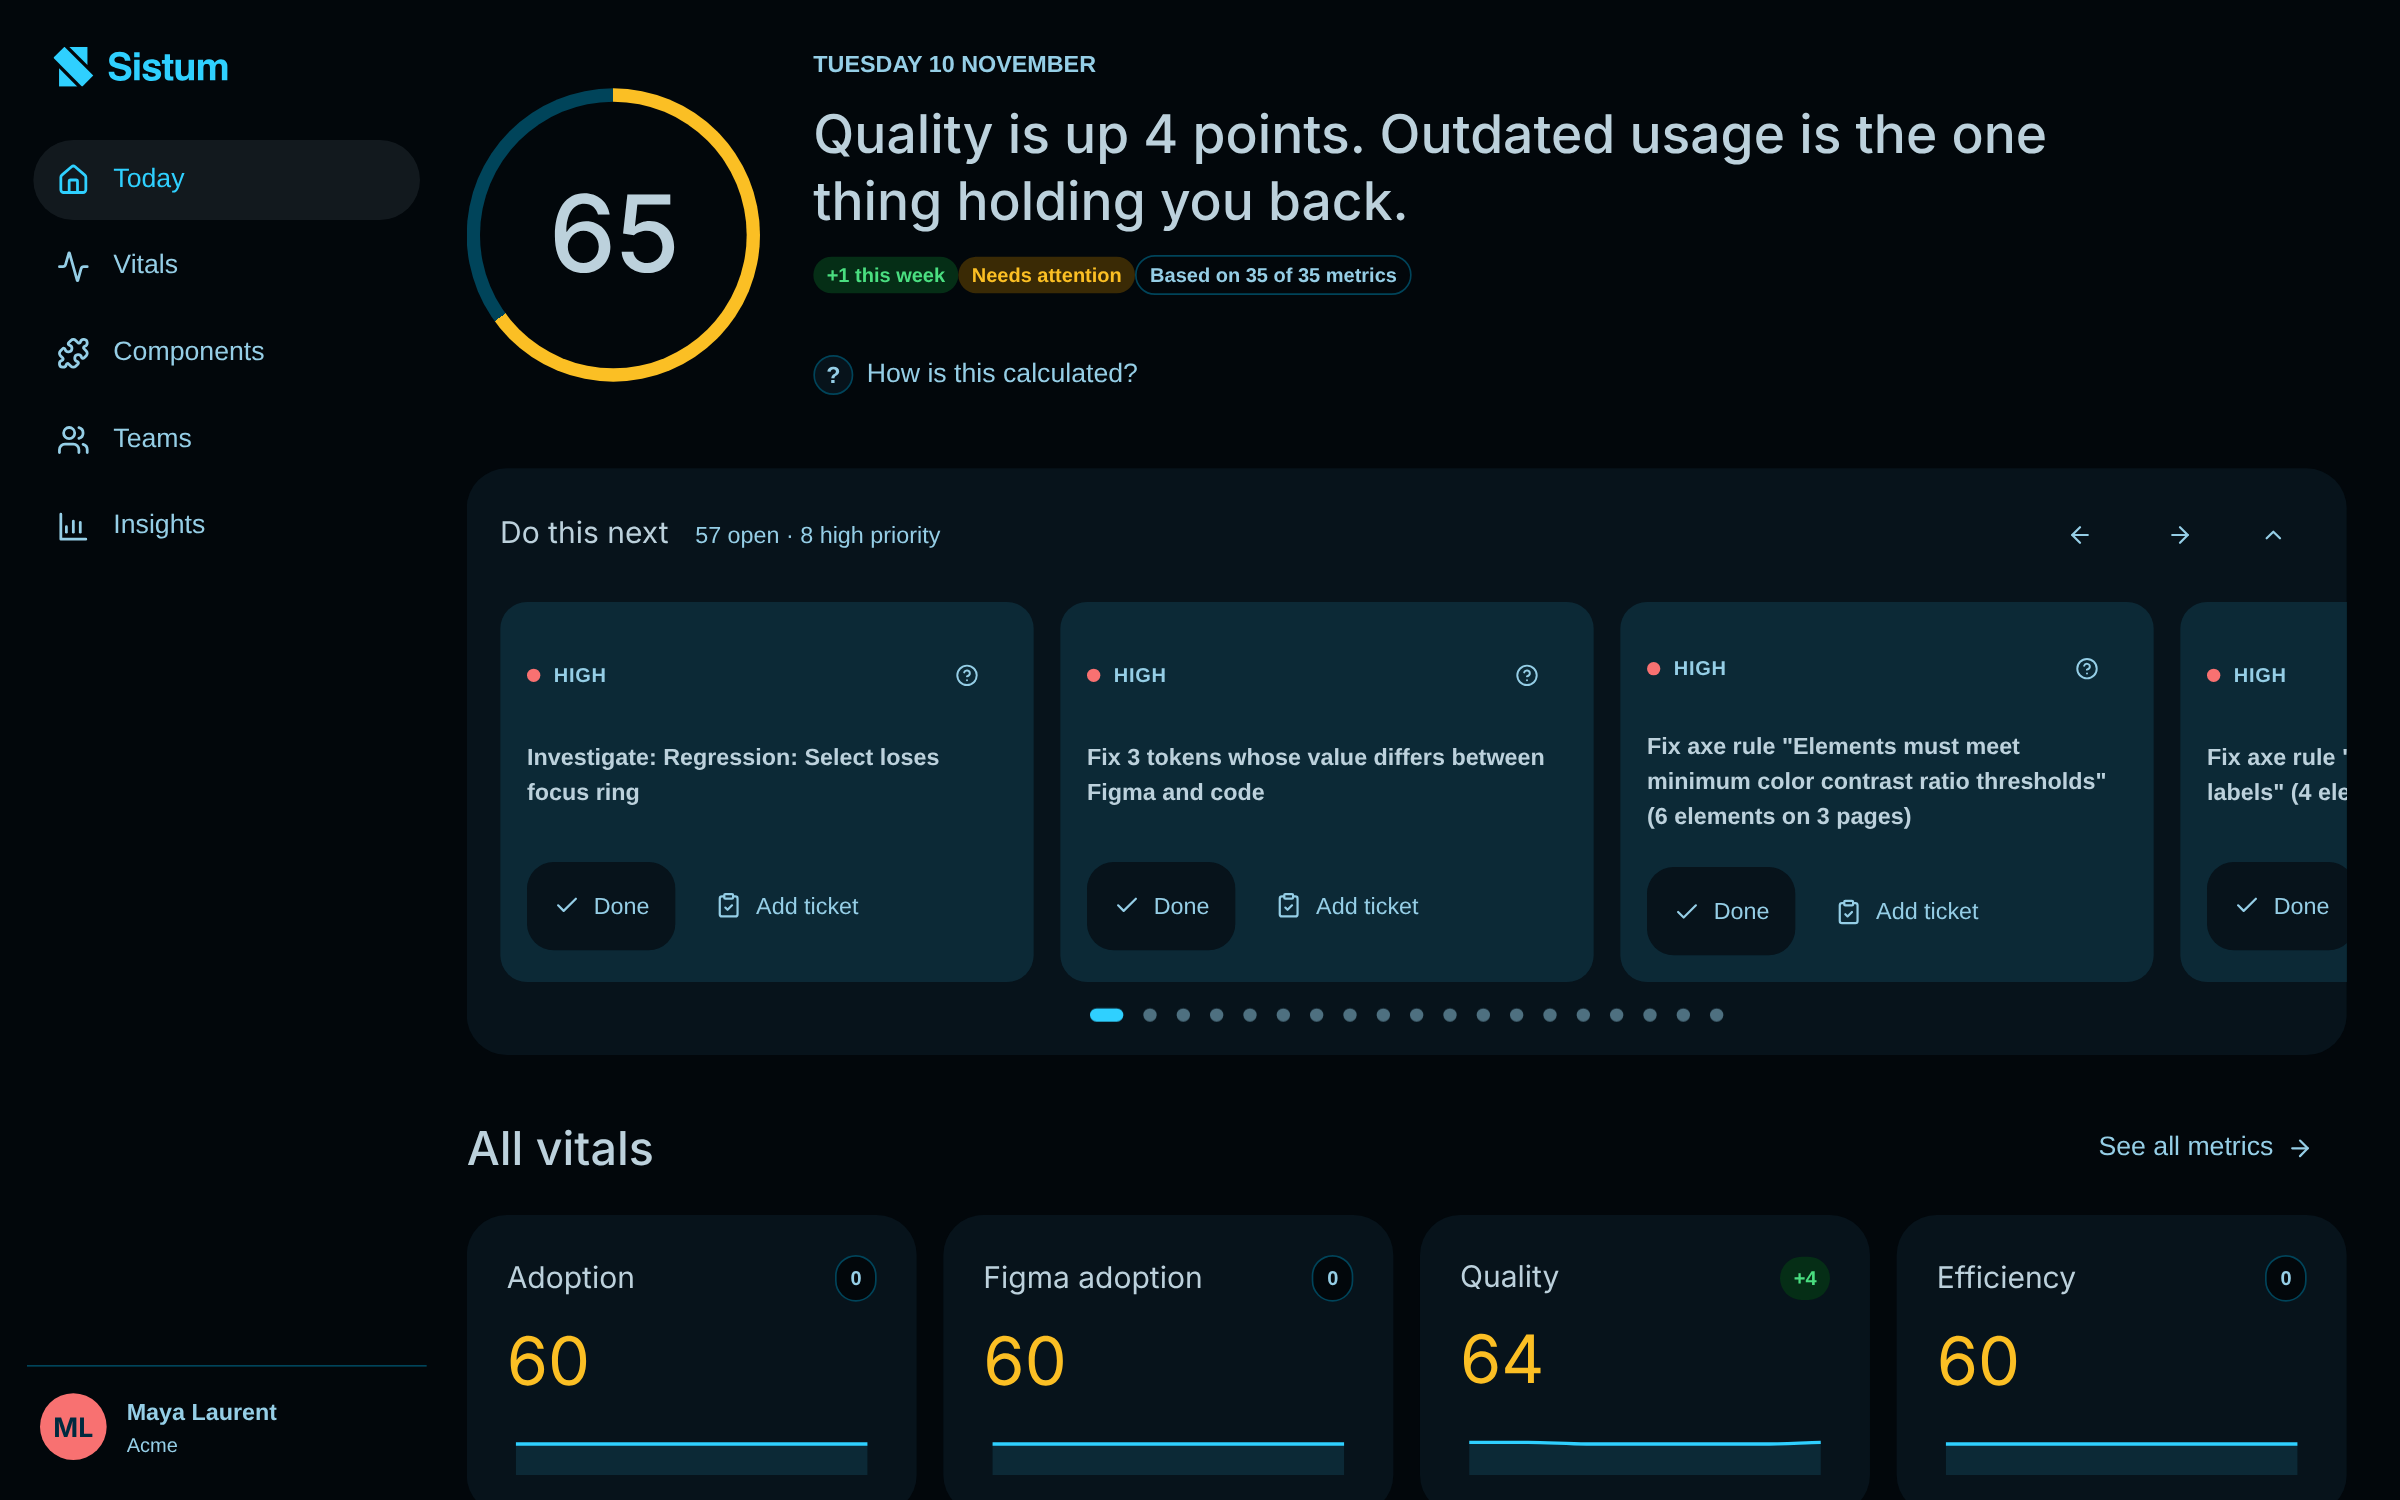
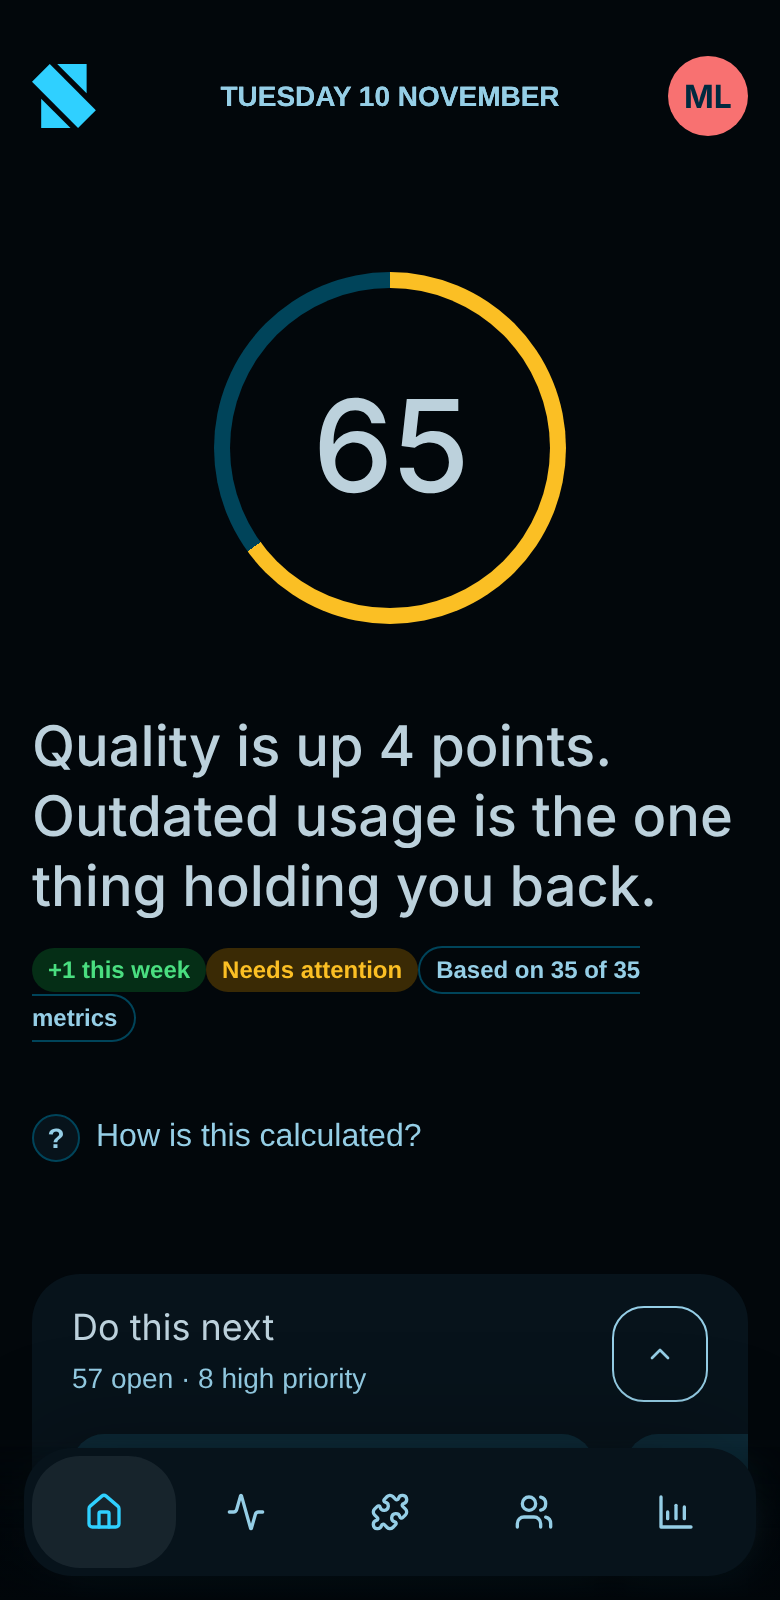
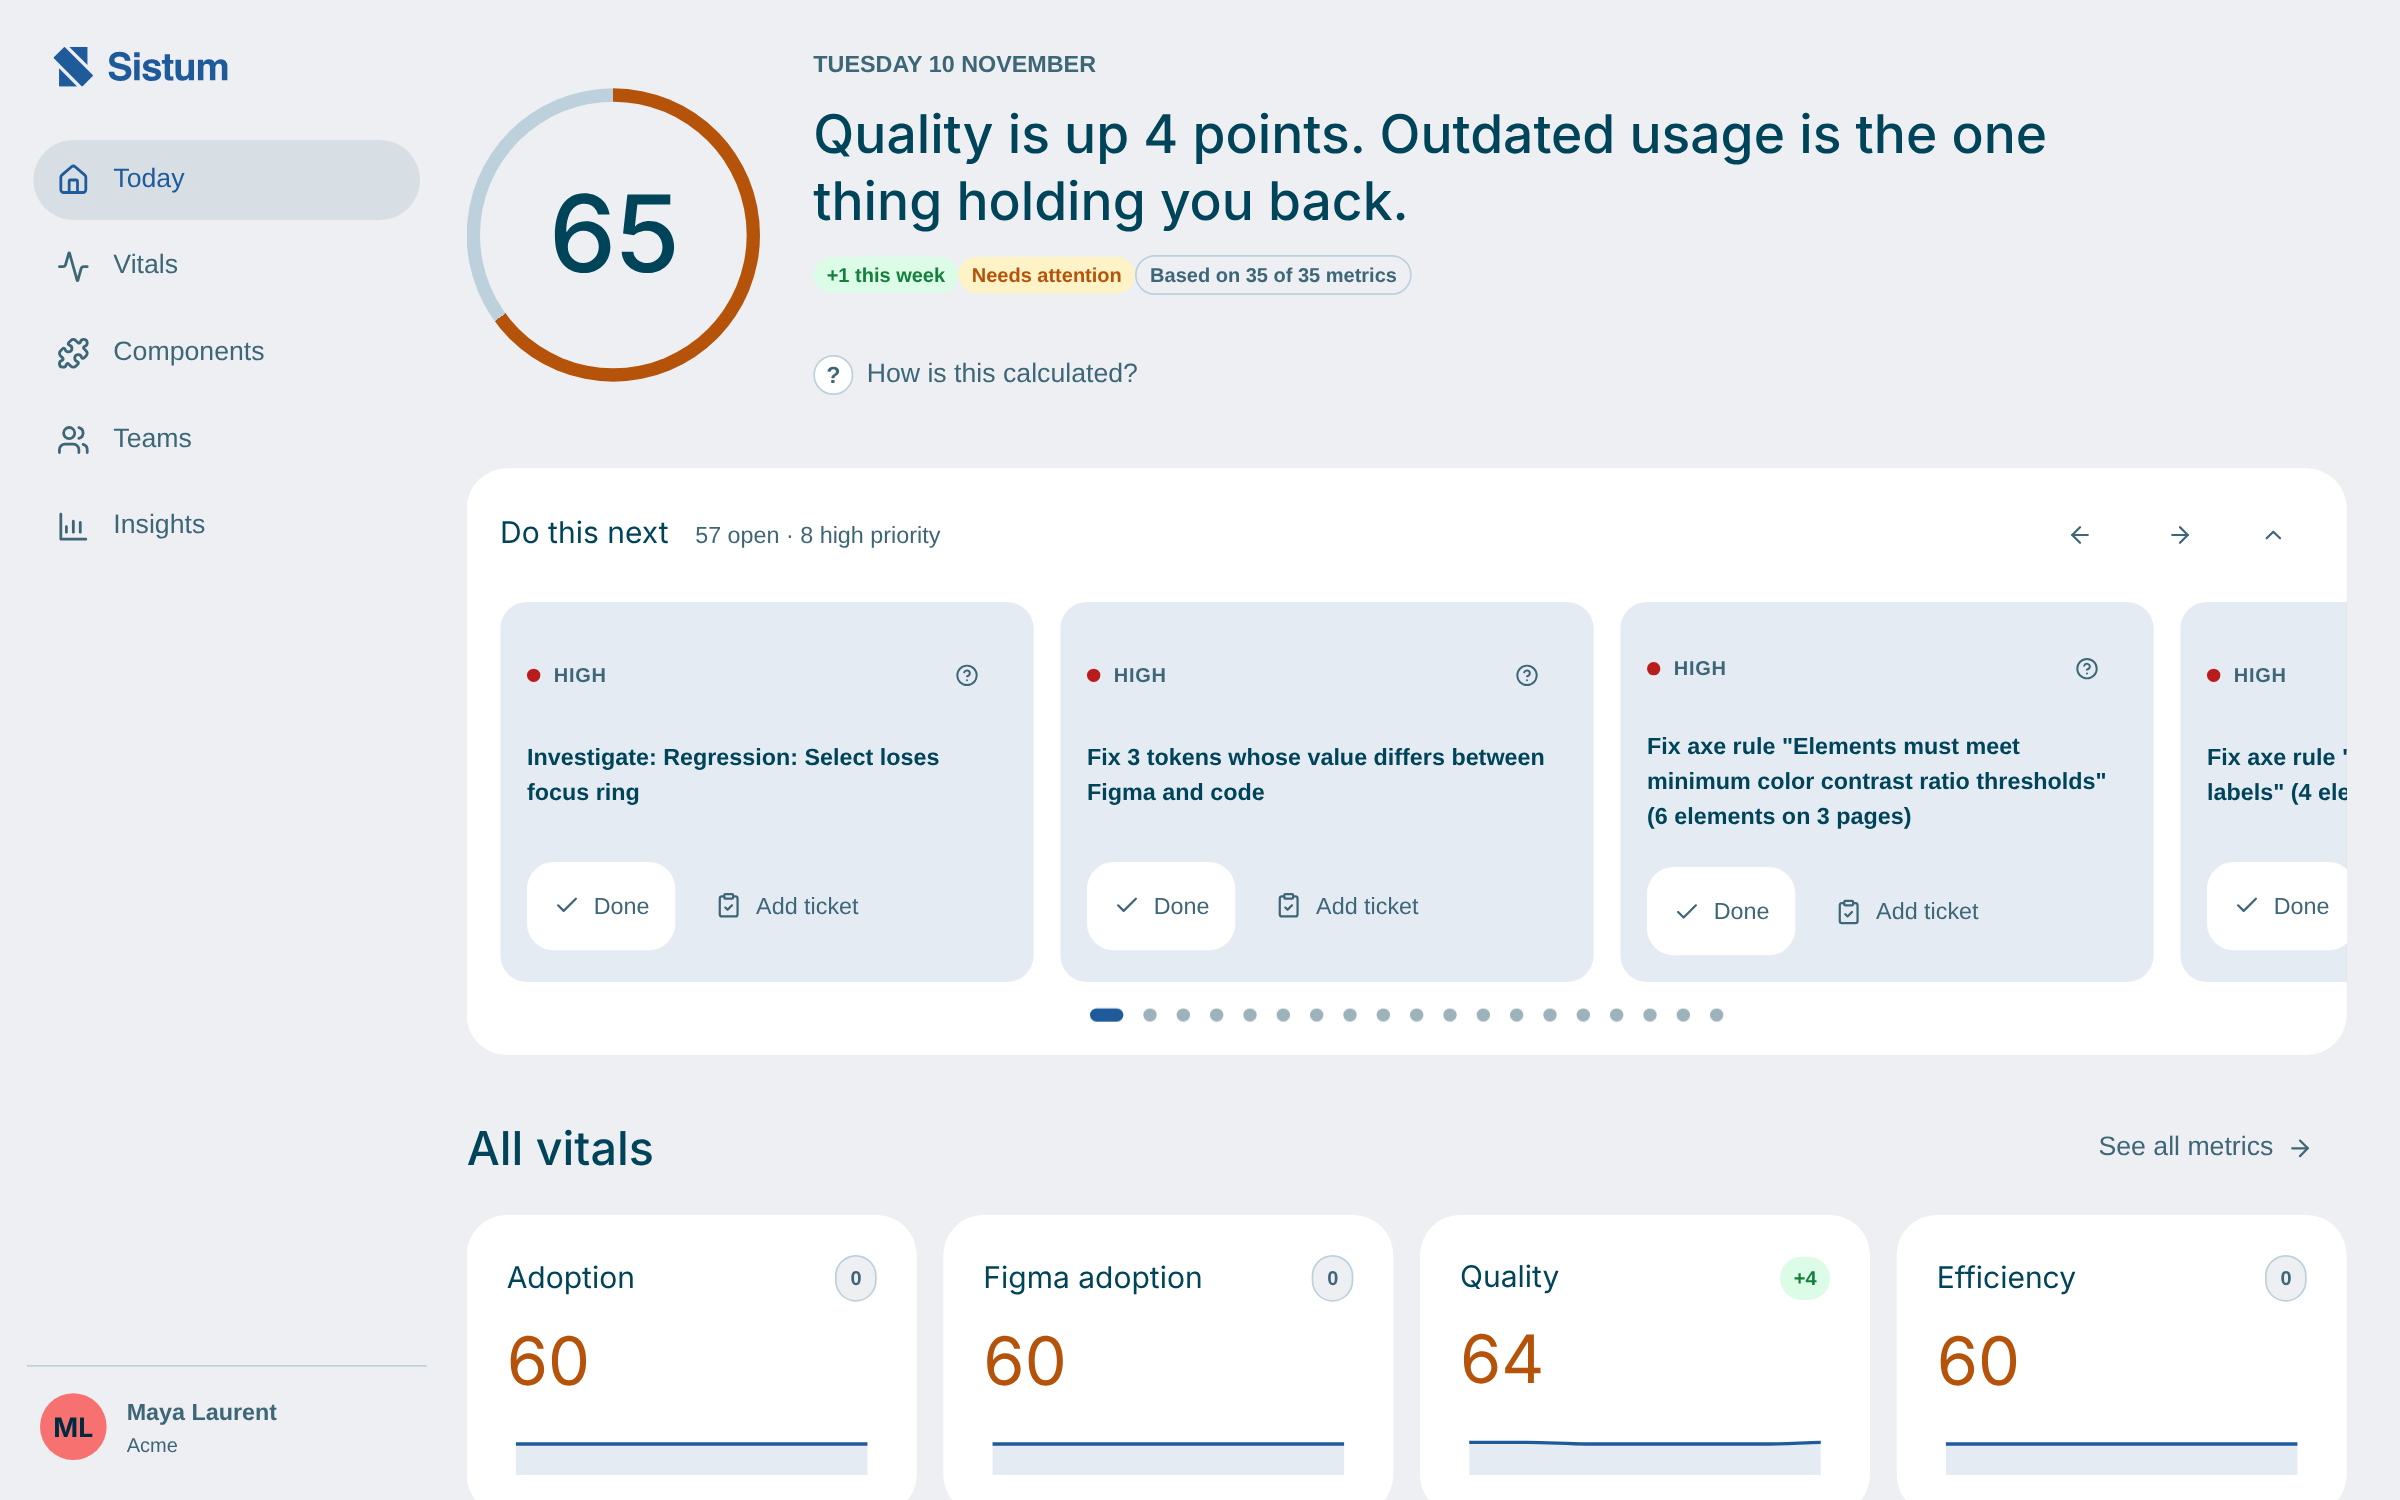
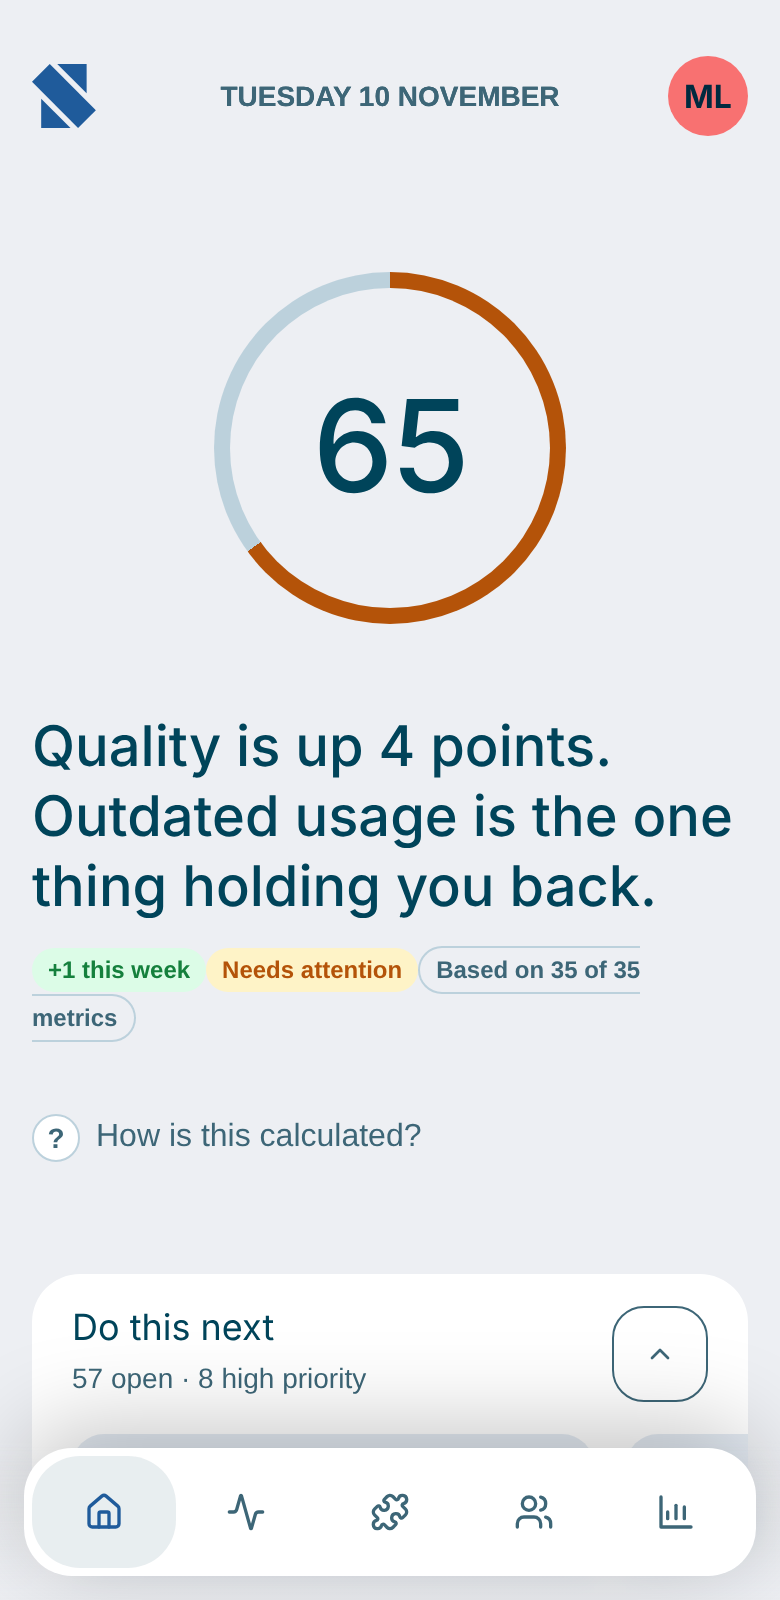
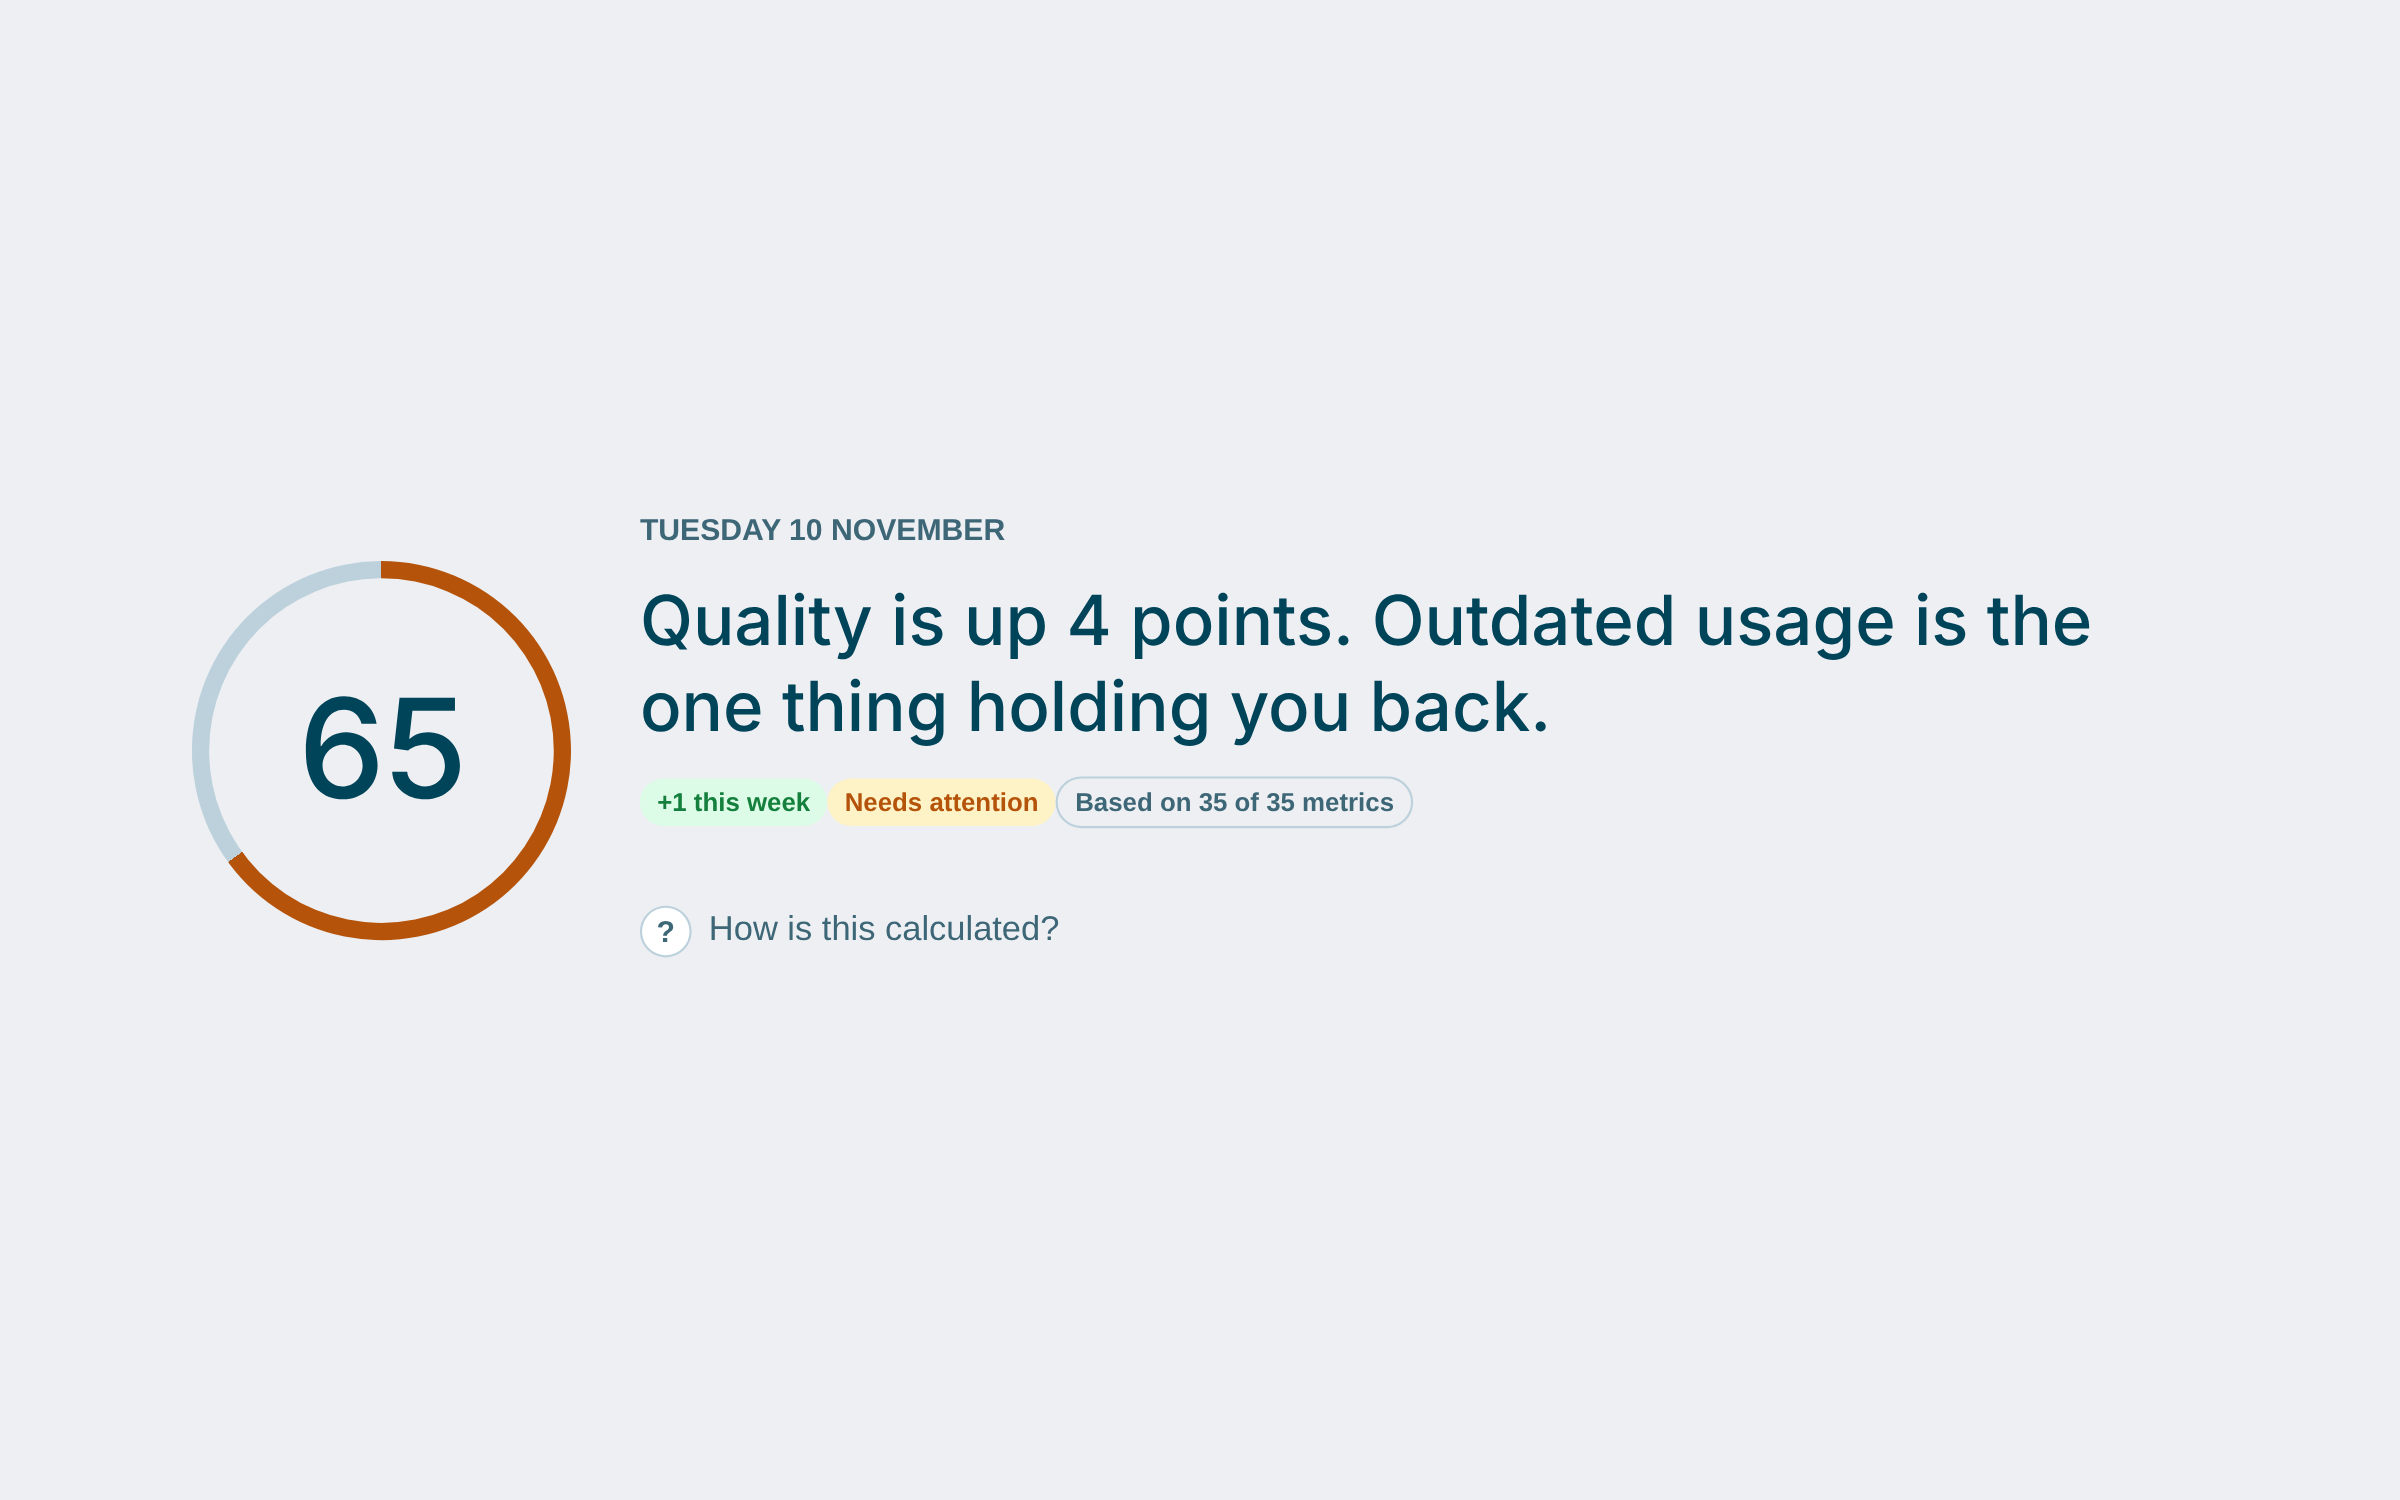
Open Sistum and know in a minute where you stand: a single Sistum score, what moved since last week, and a plain-language verdict you can repeat to your manager. No wall of charts to decode.
02 / Priorities
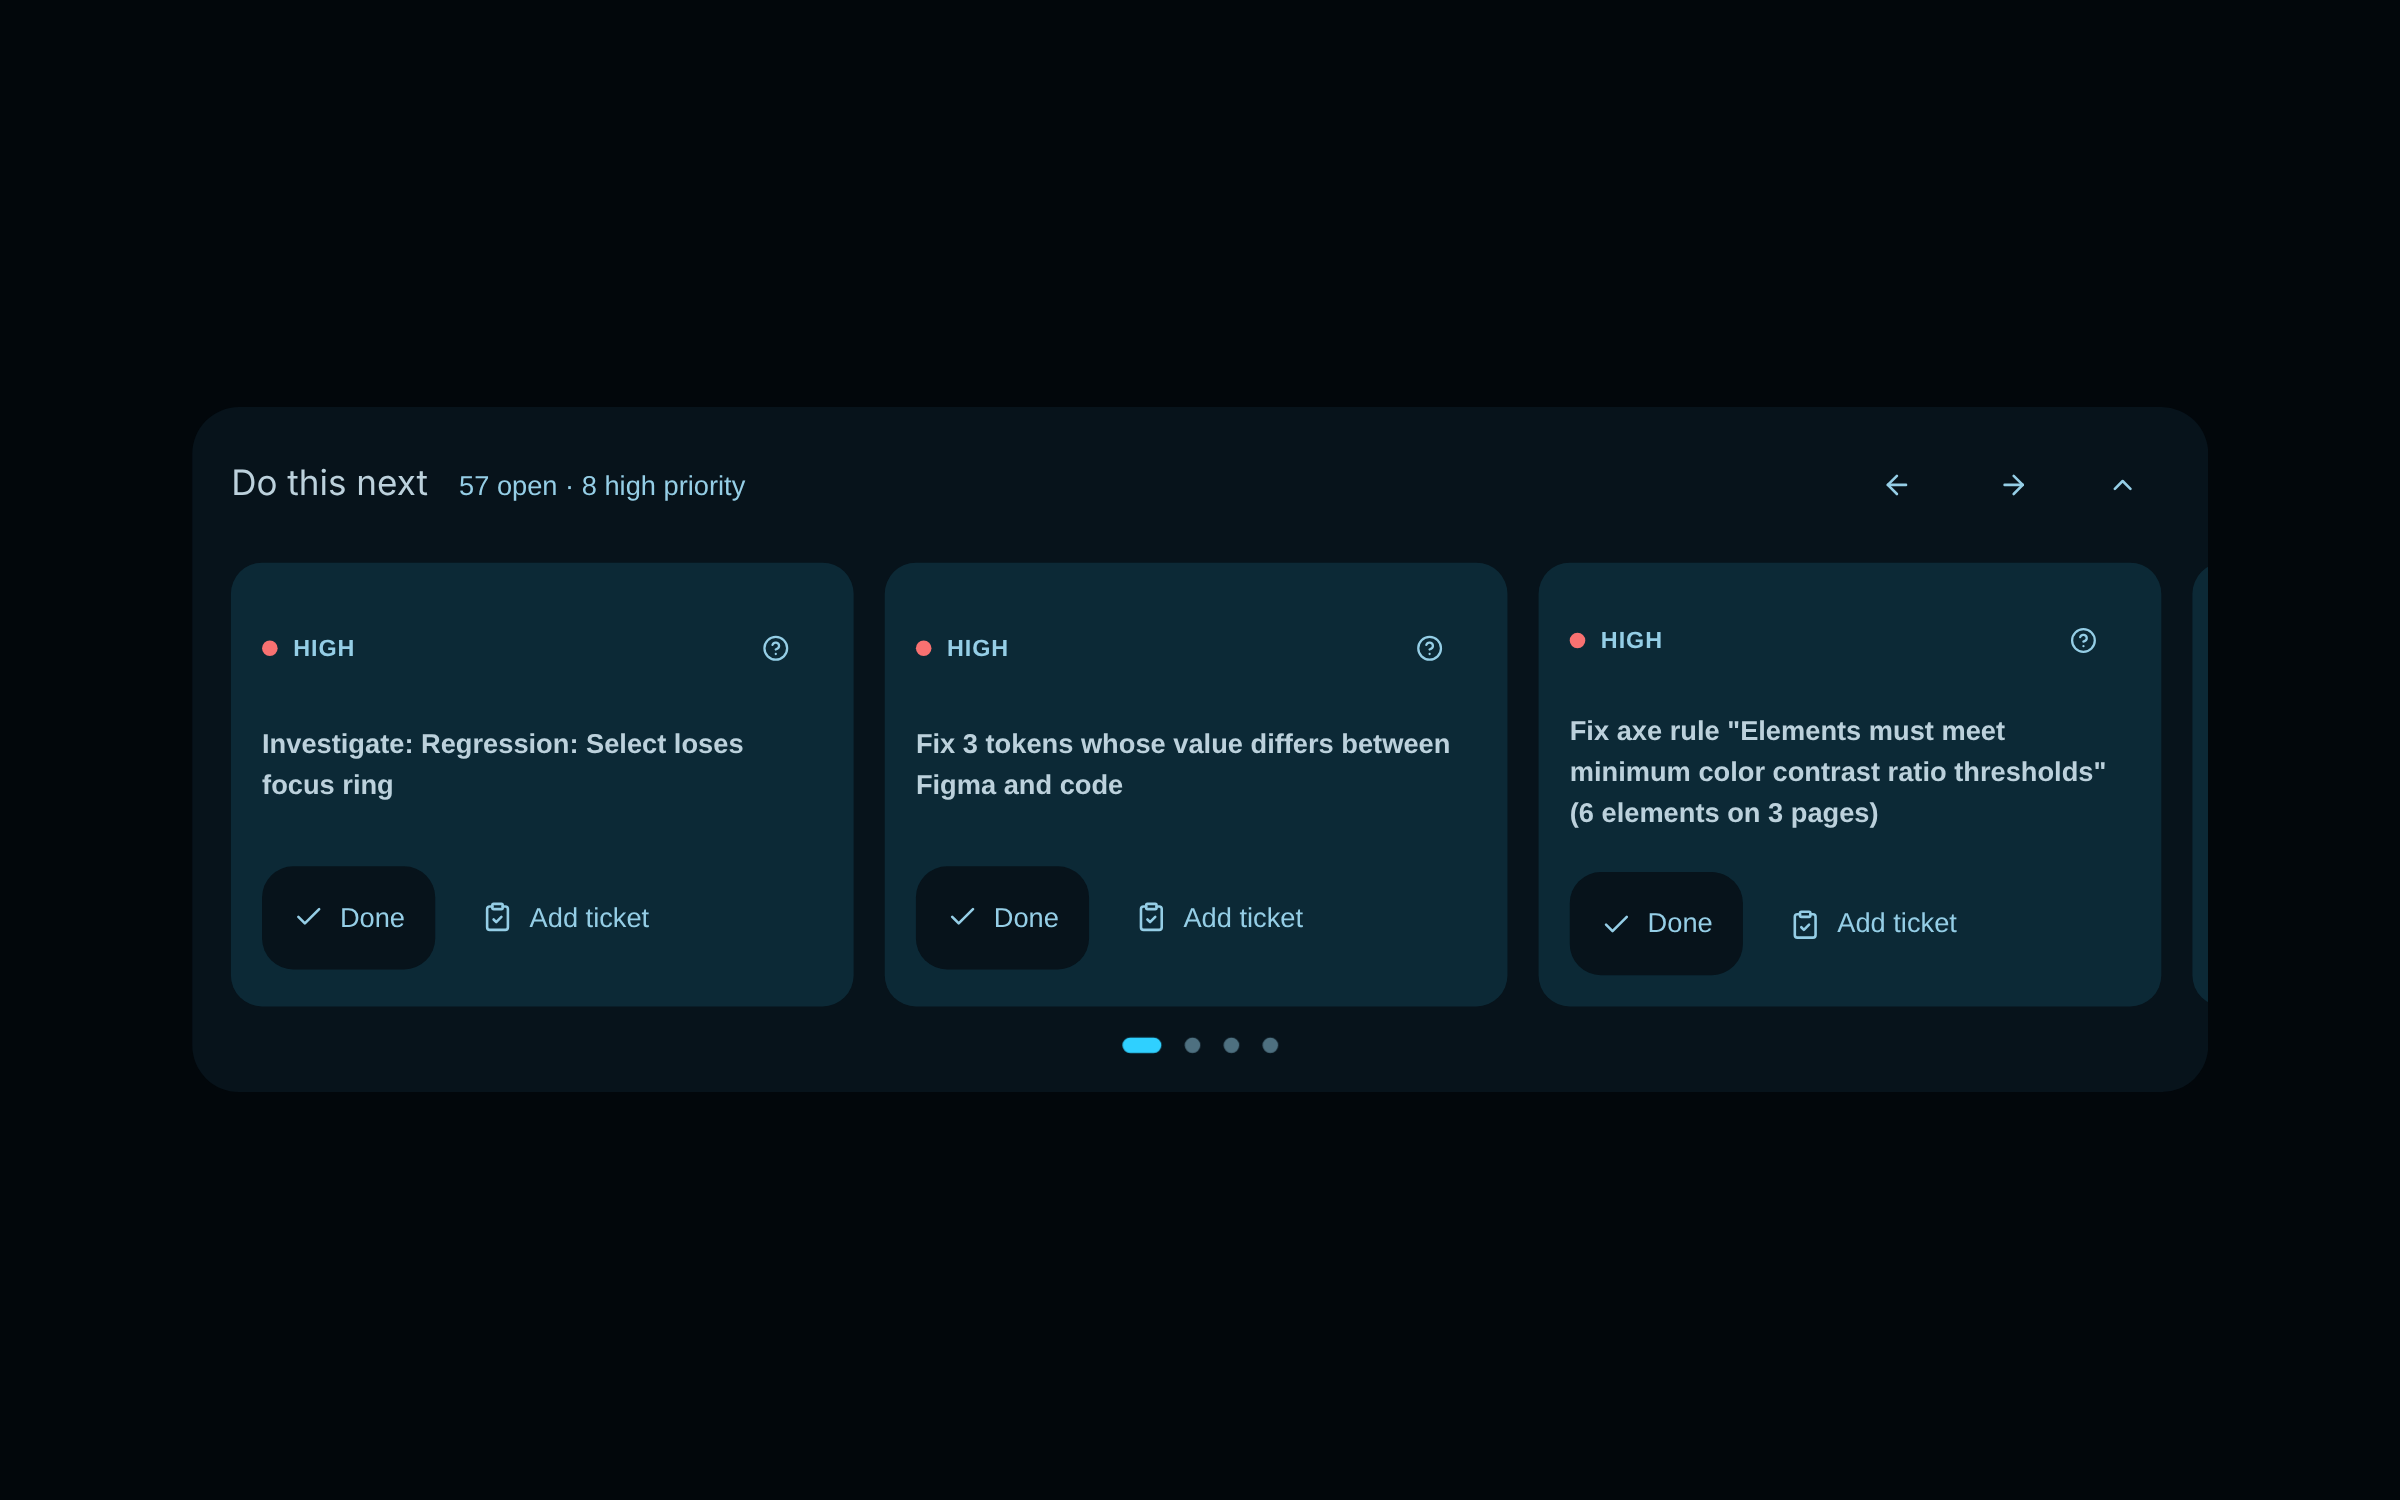
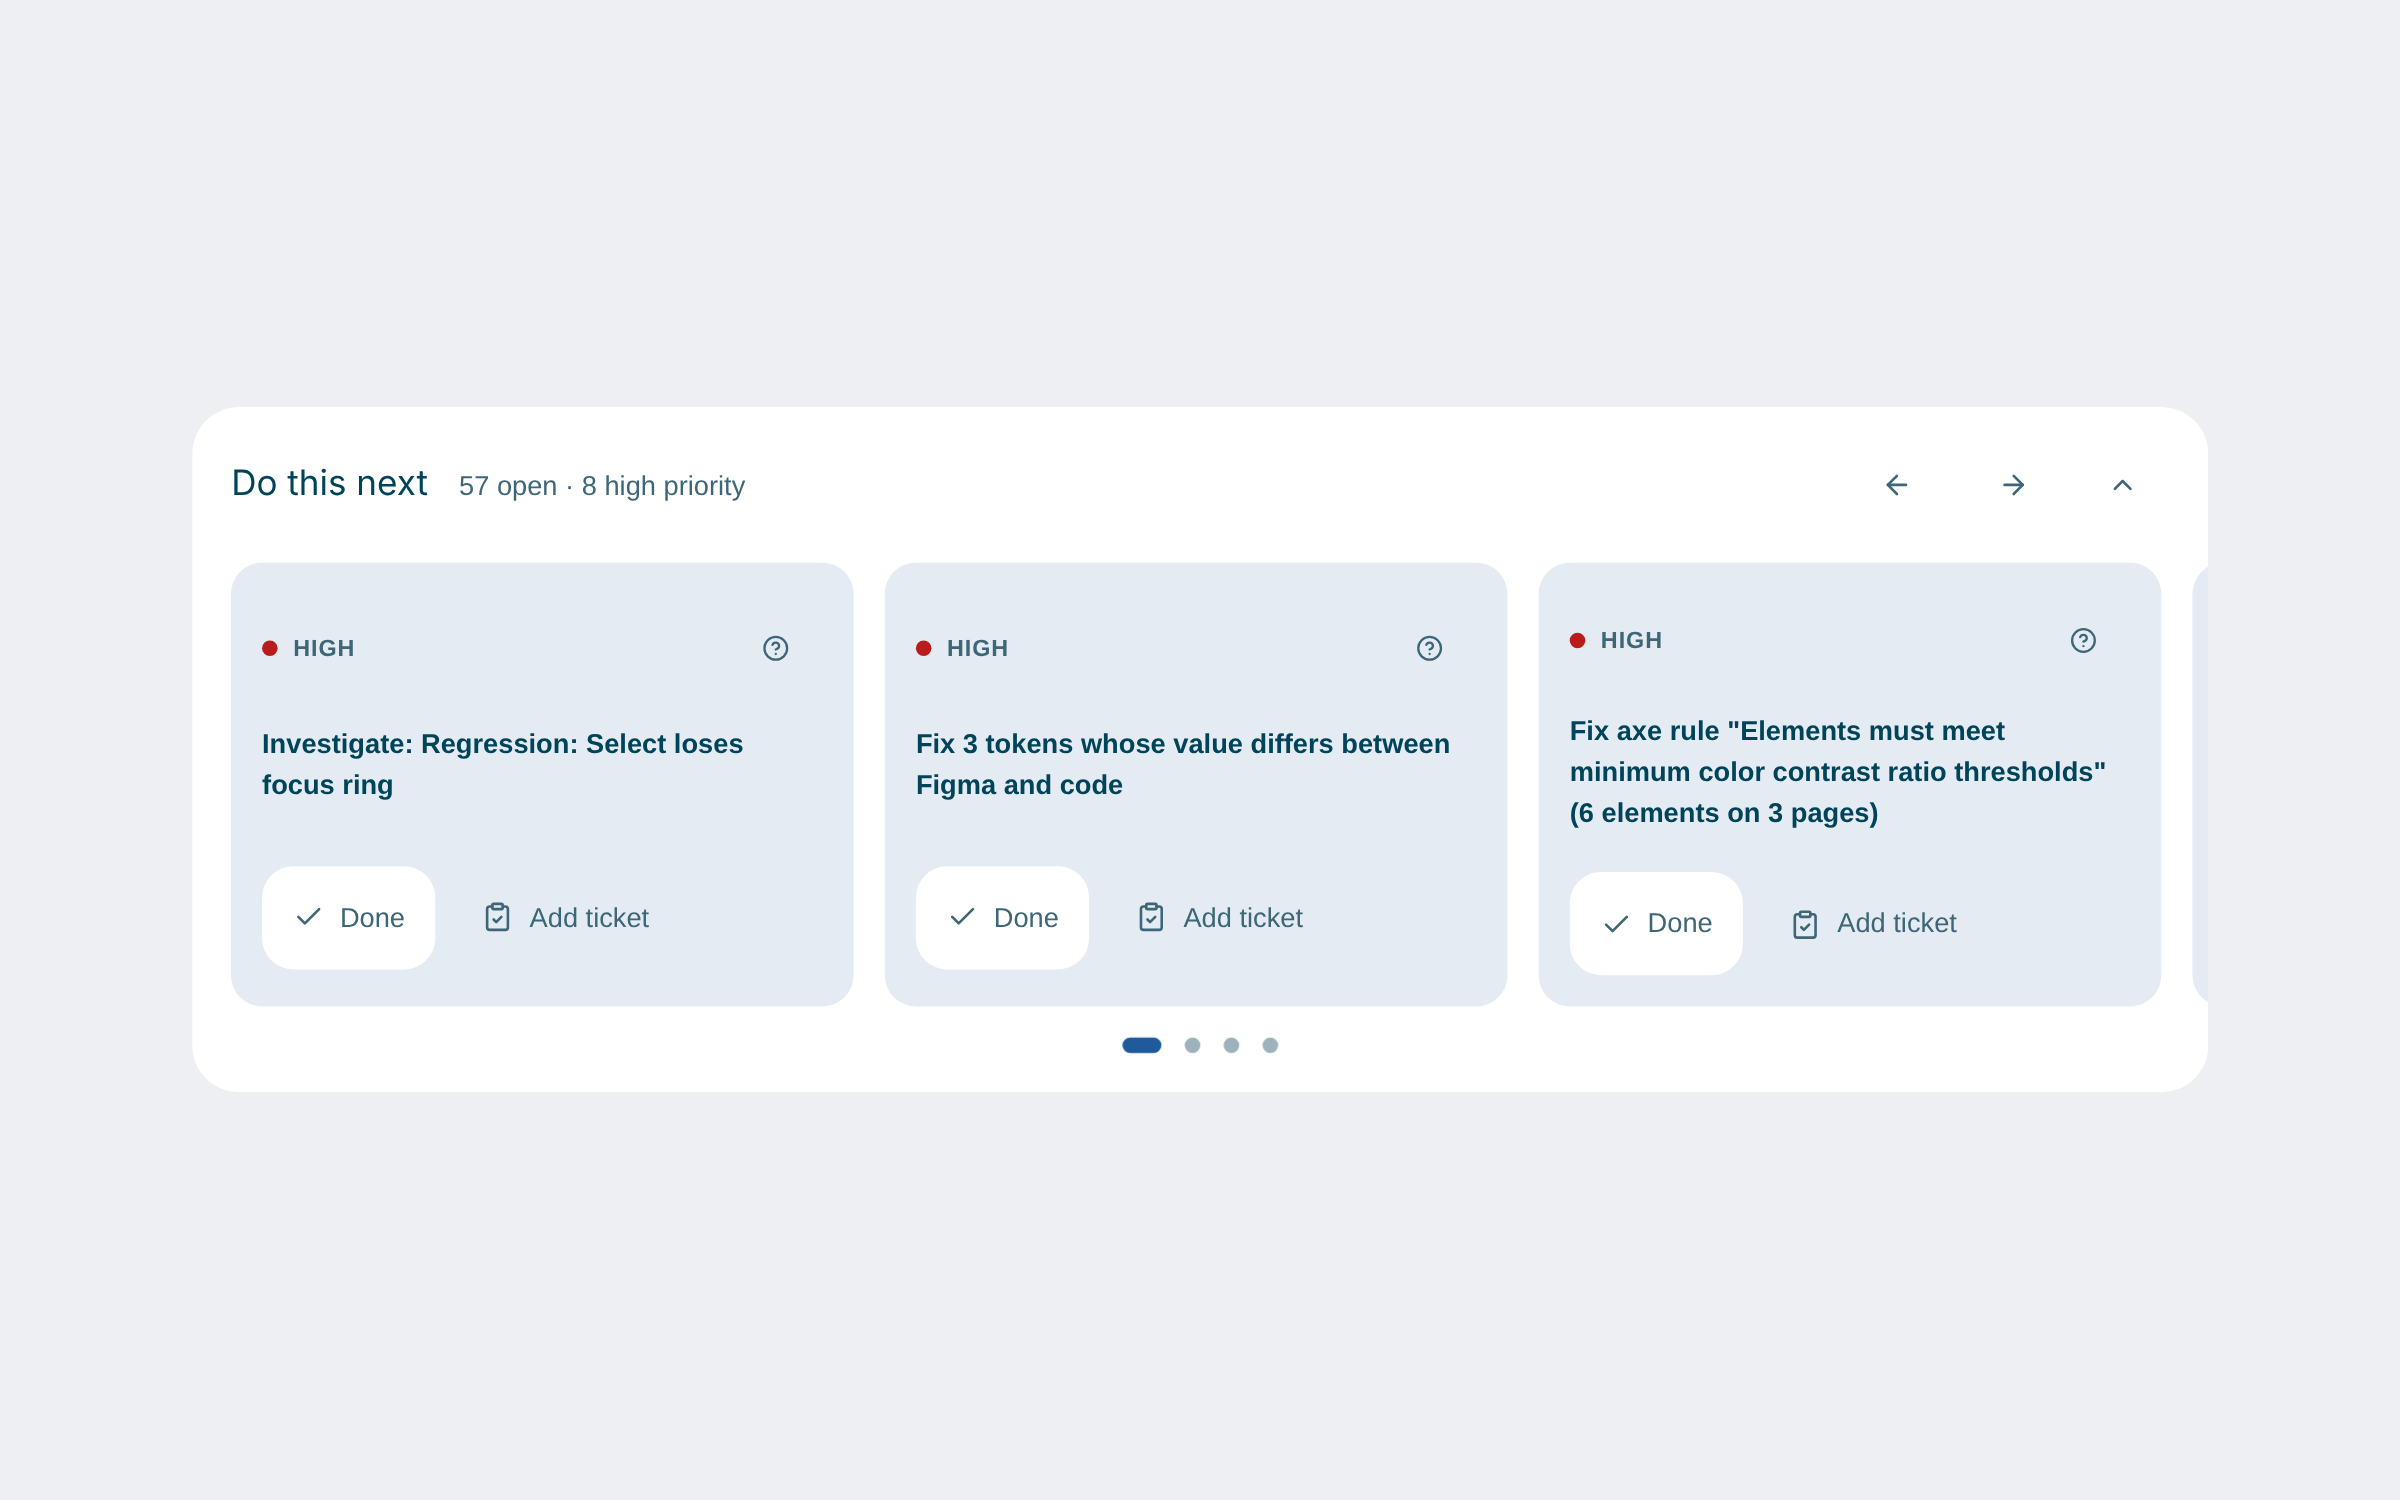
Every refresh ends with a short list of what to do next, in priority order, with the evidence behind each item. Mark it done or turn it into a ticket in Jira, Linear, Bitbucket, GitHub or GitLab.
03 / Vitals
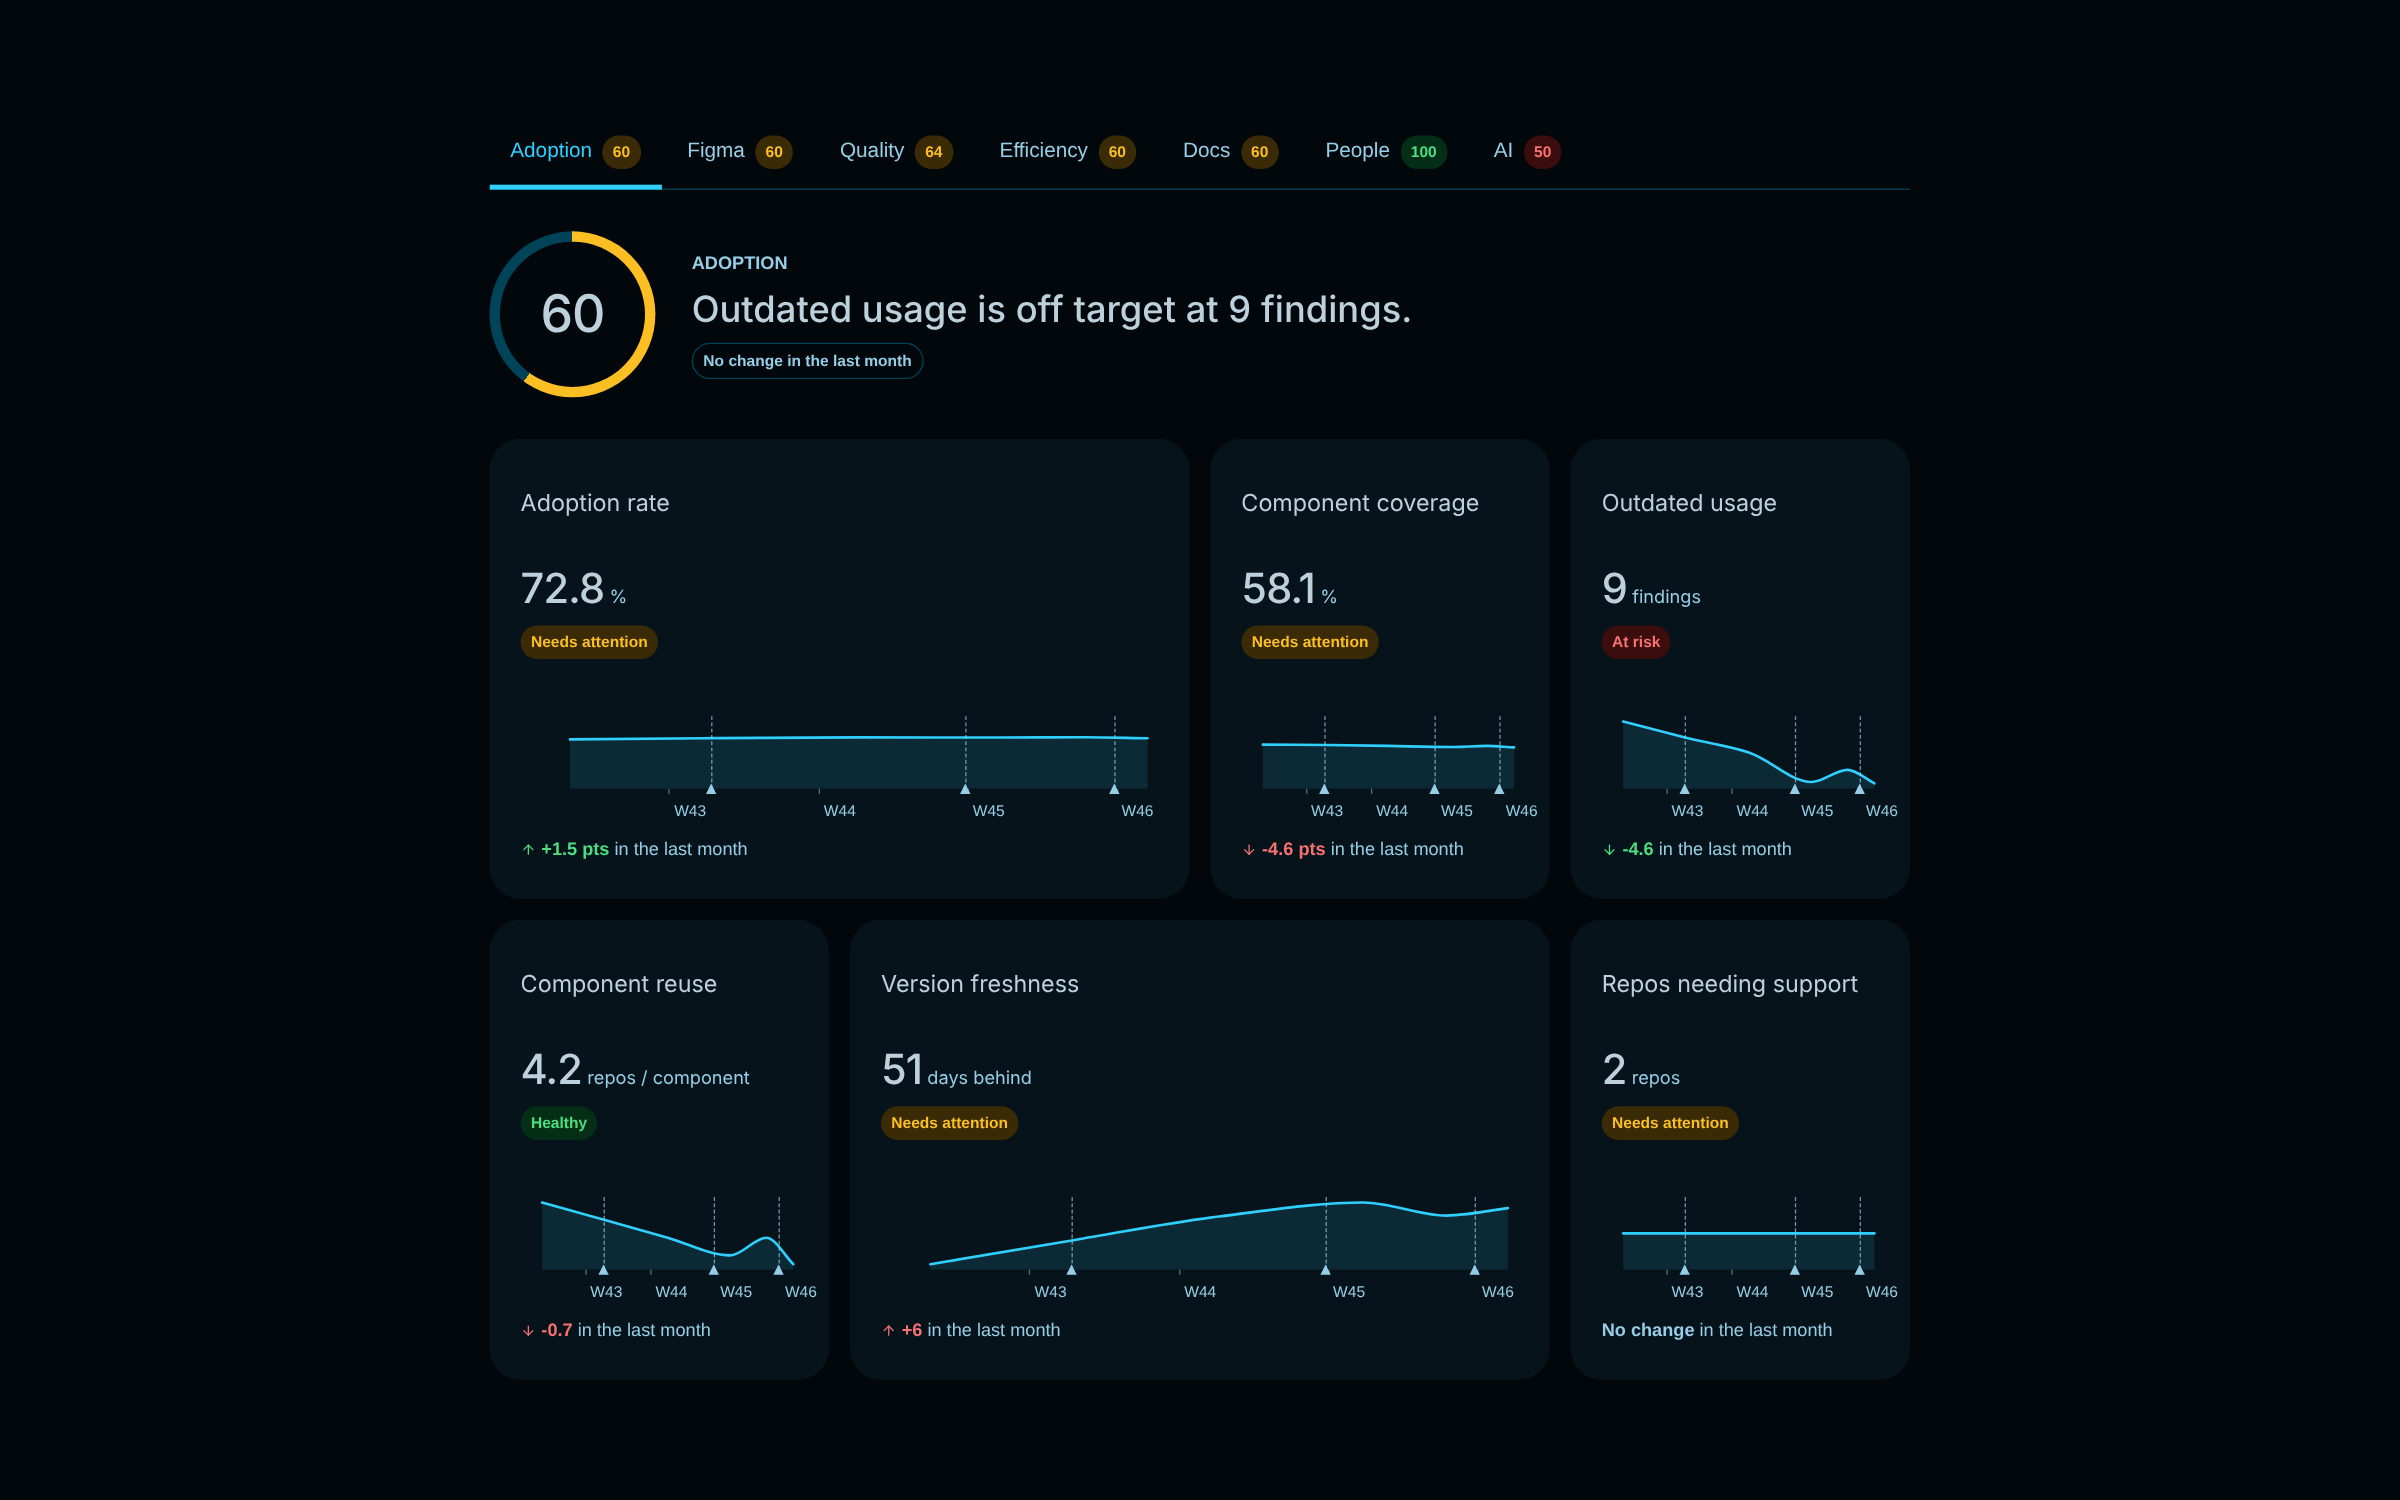
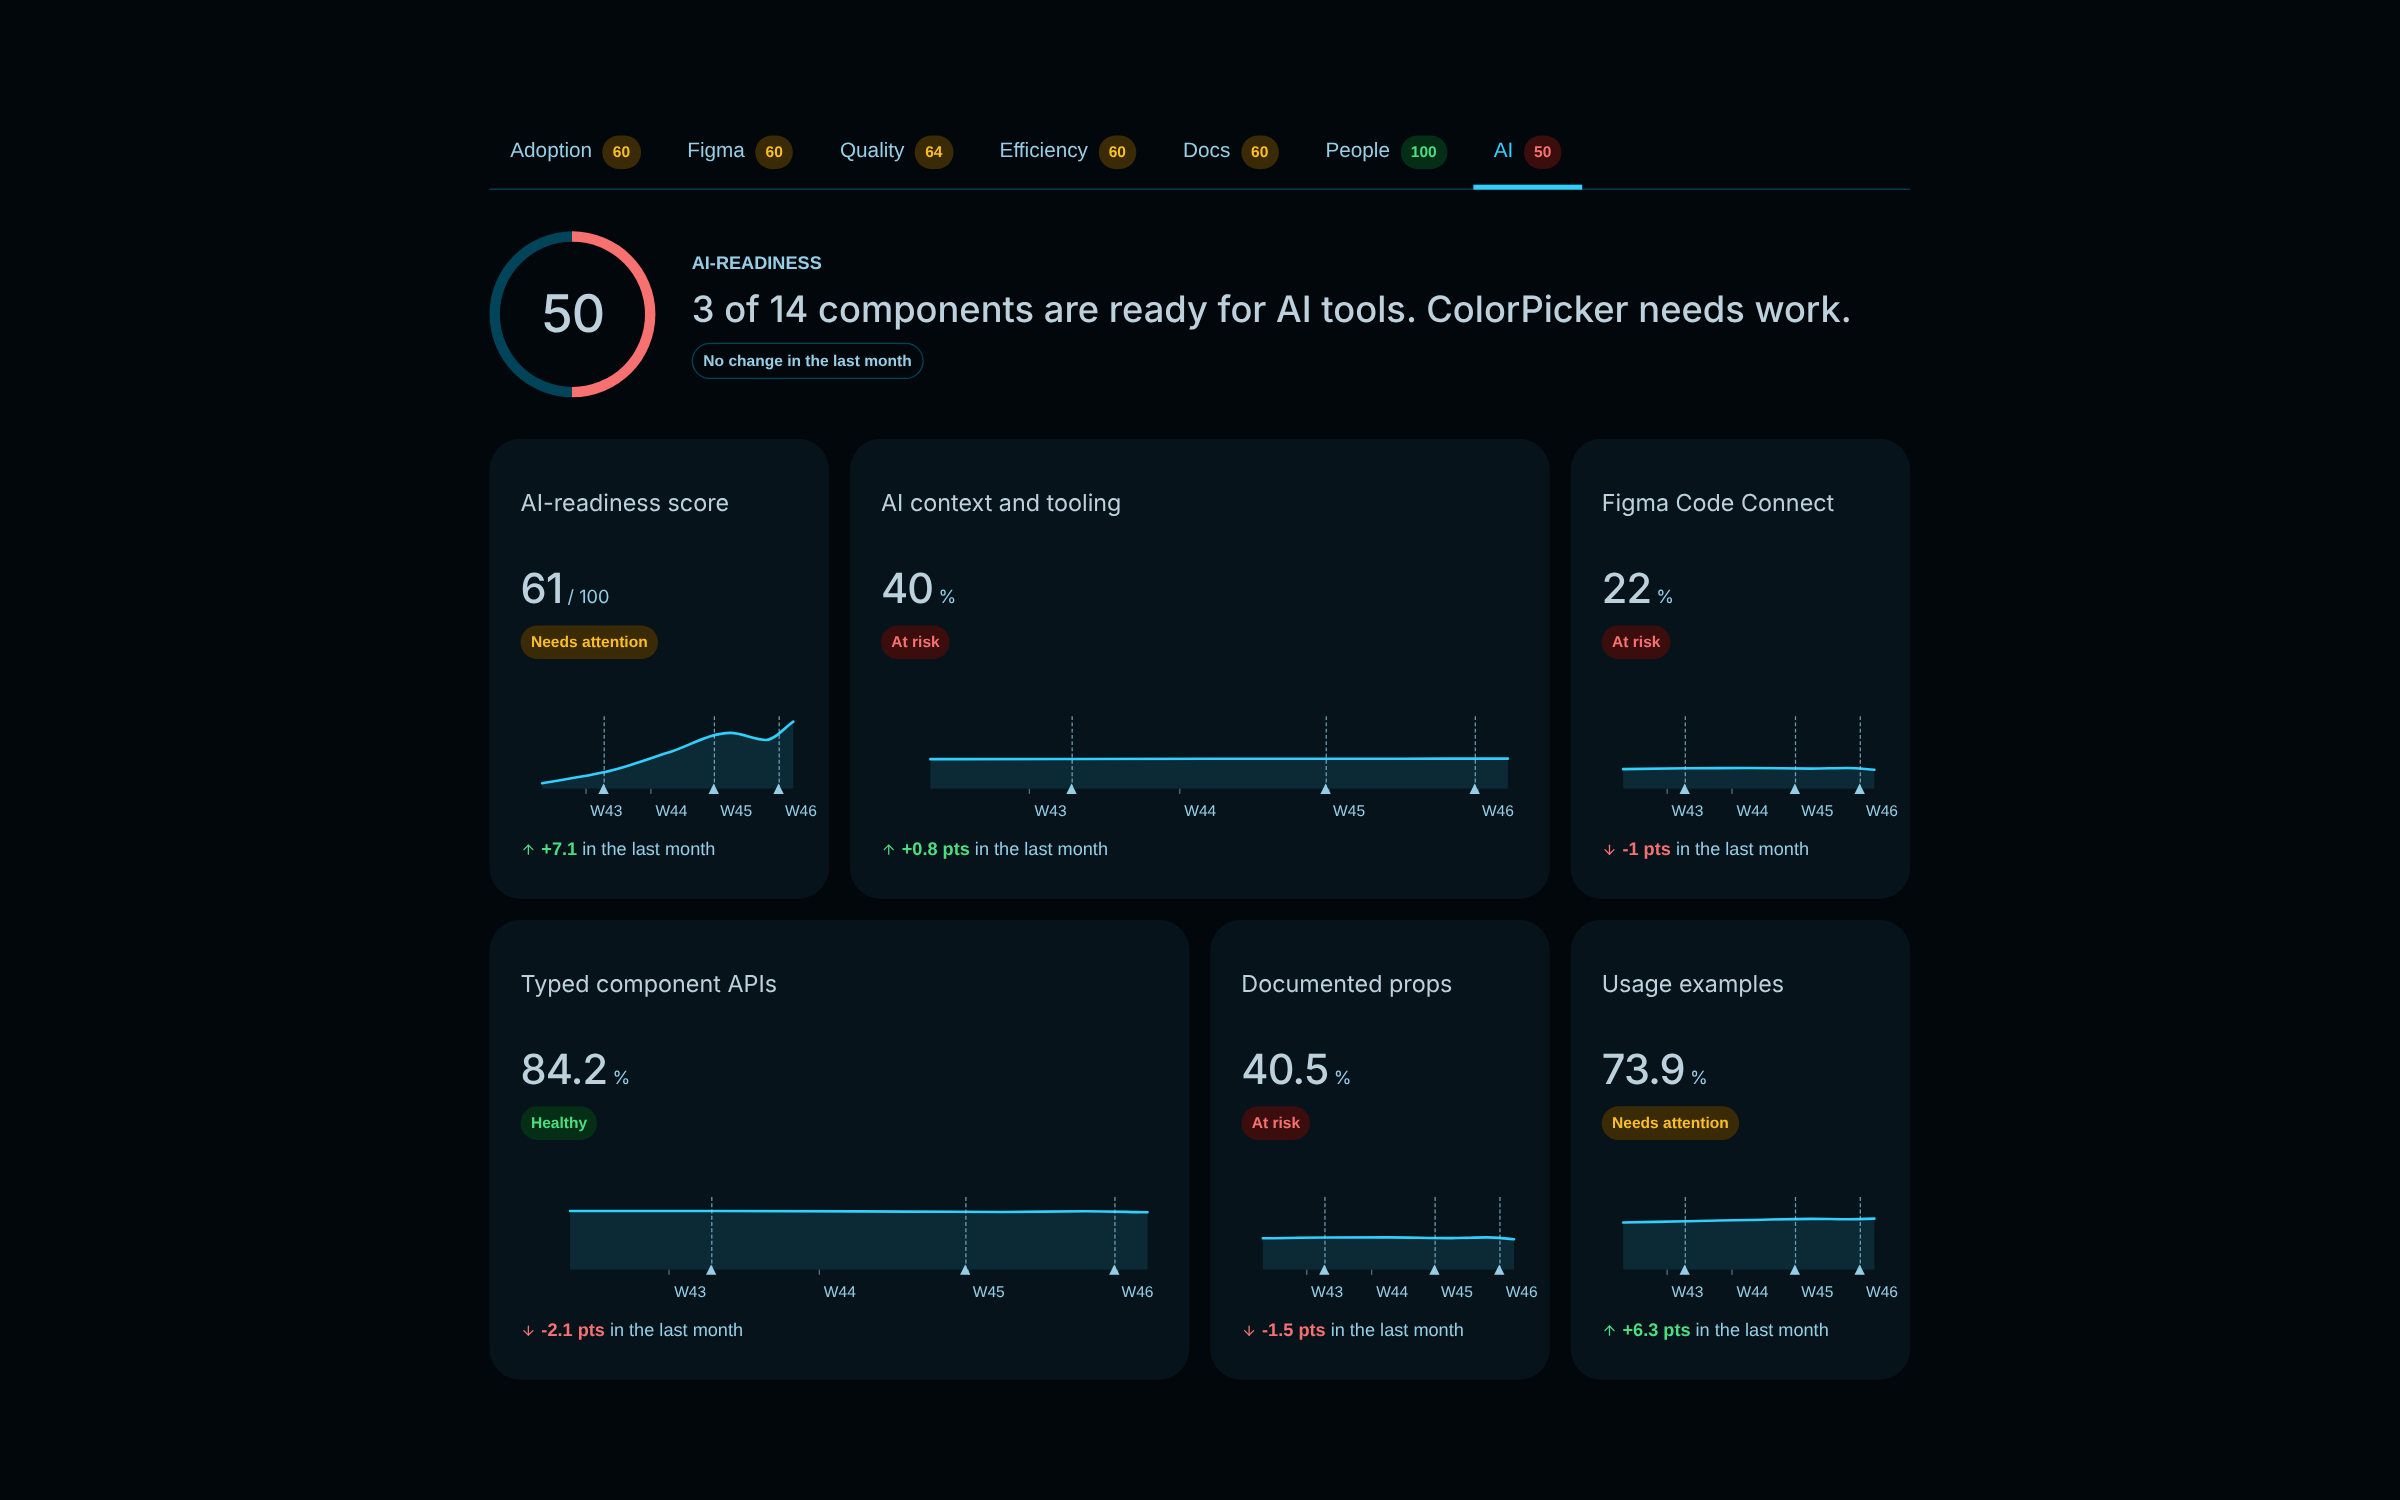
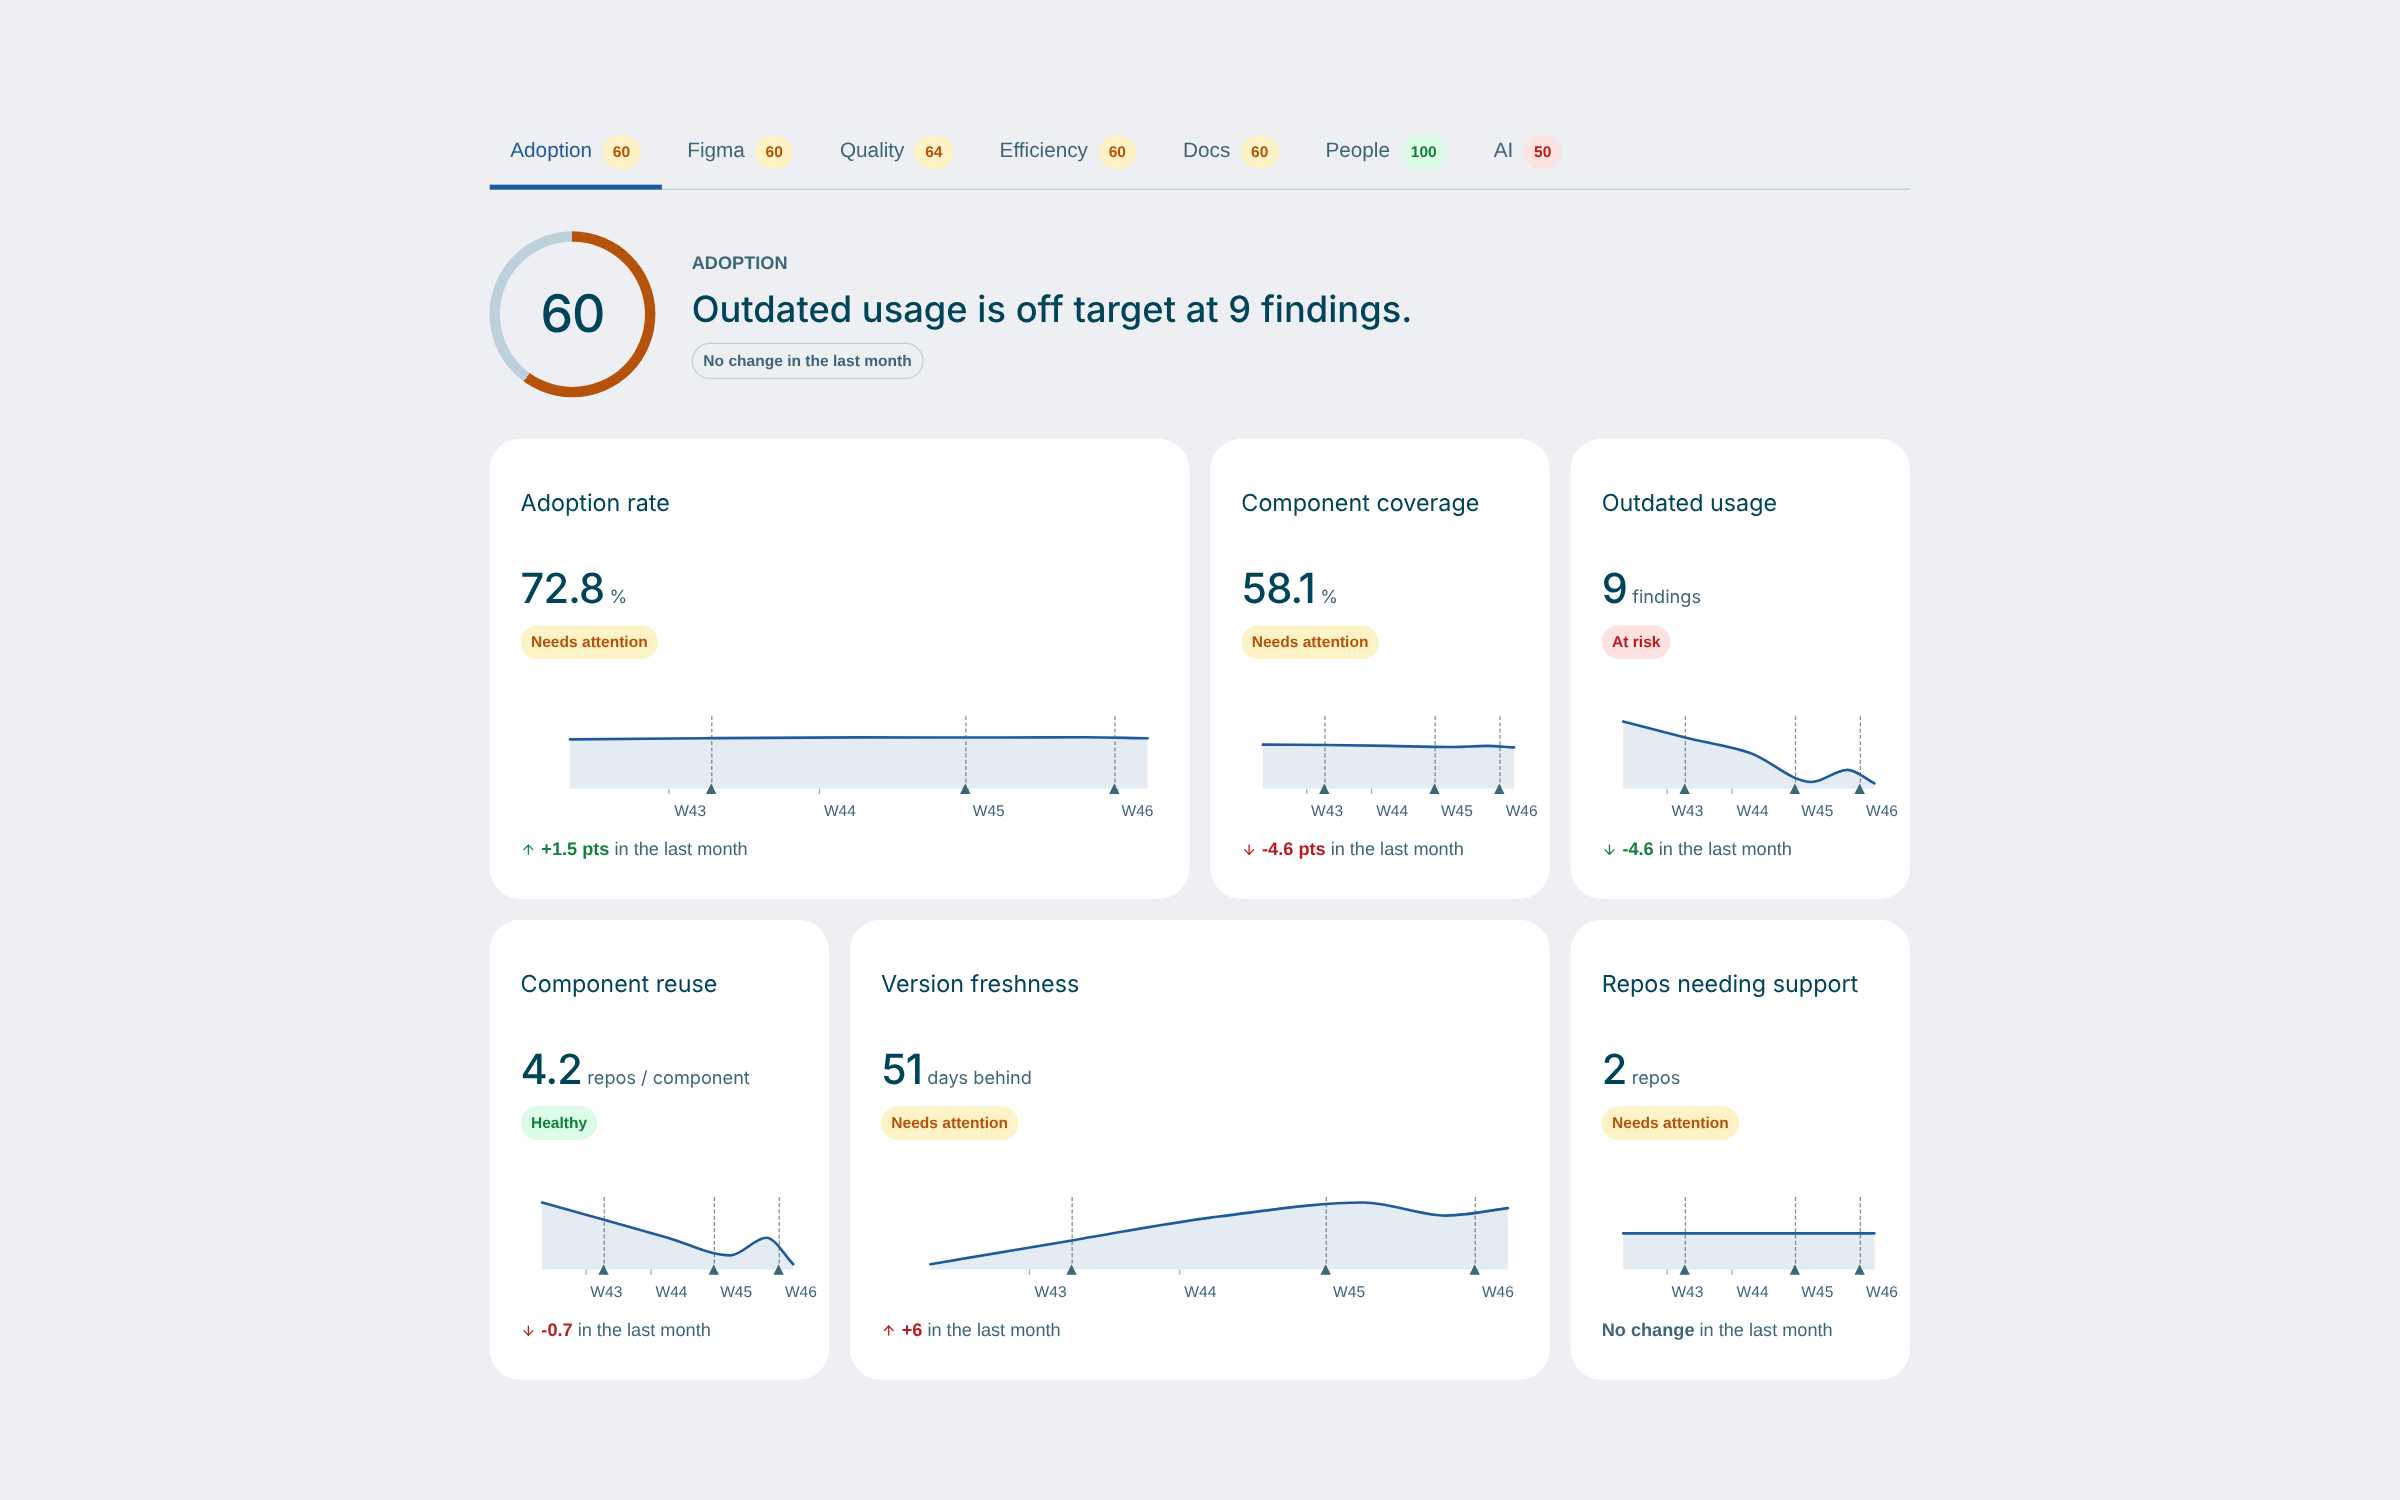
Adoption, quality, efficiency, docs, people, AI-readiness and Figma adoption. The vital that needs attention opens by itself, and every metric explains how it is calculated.
04 / Components
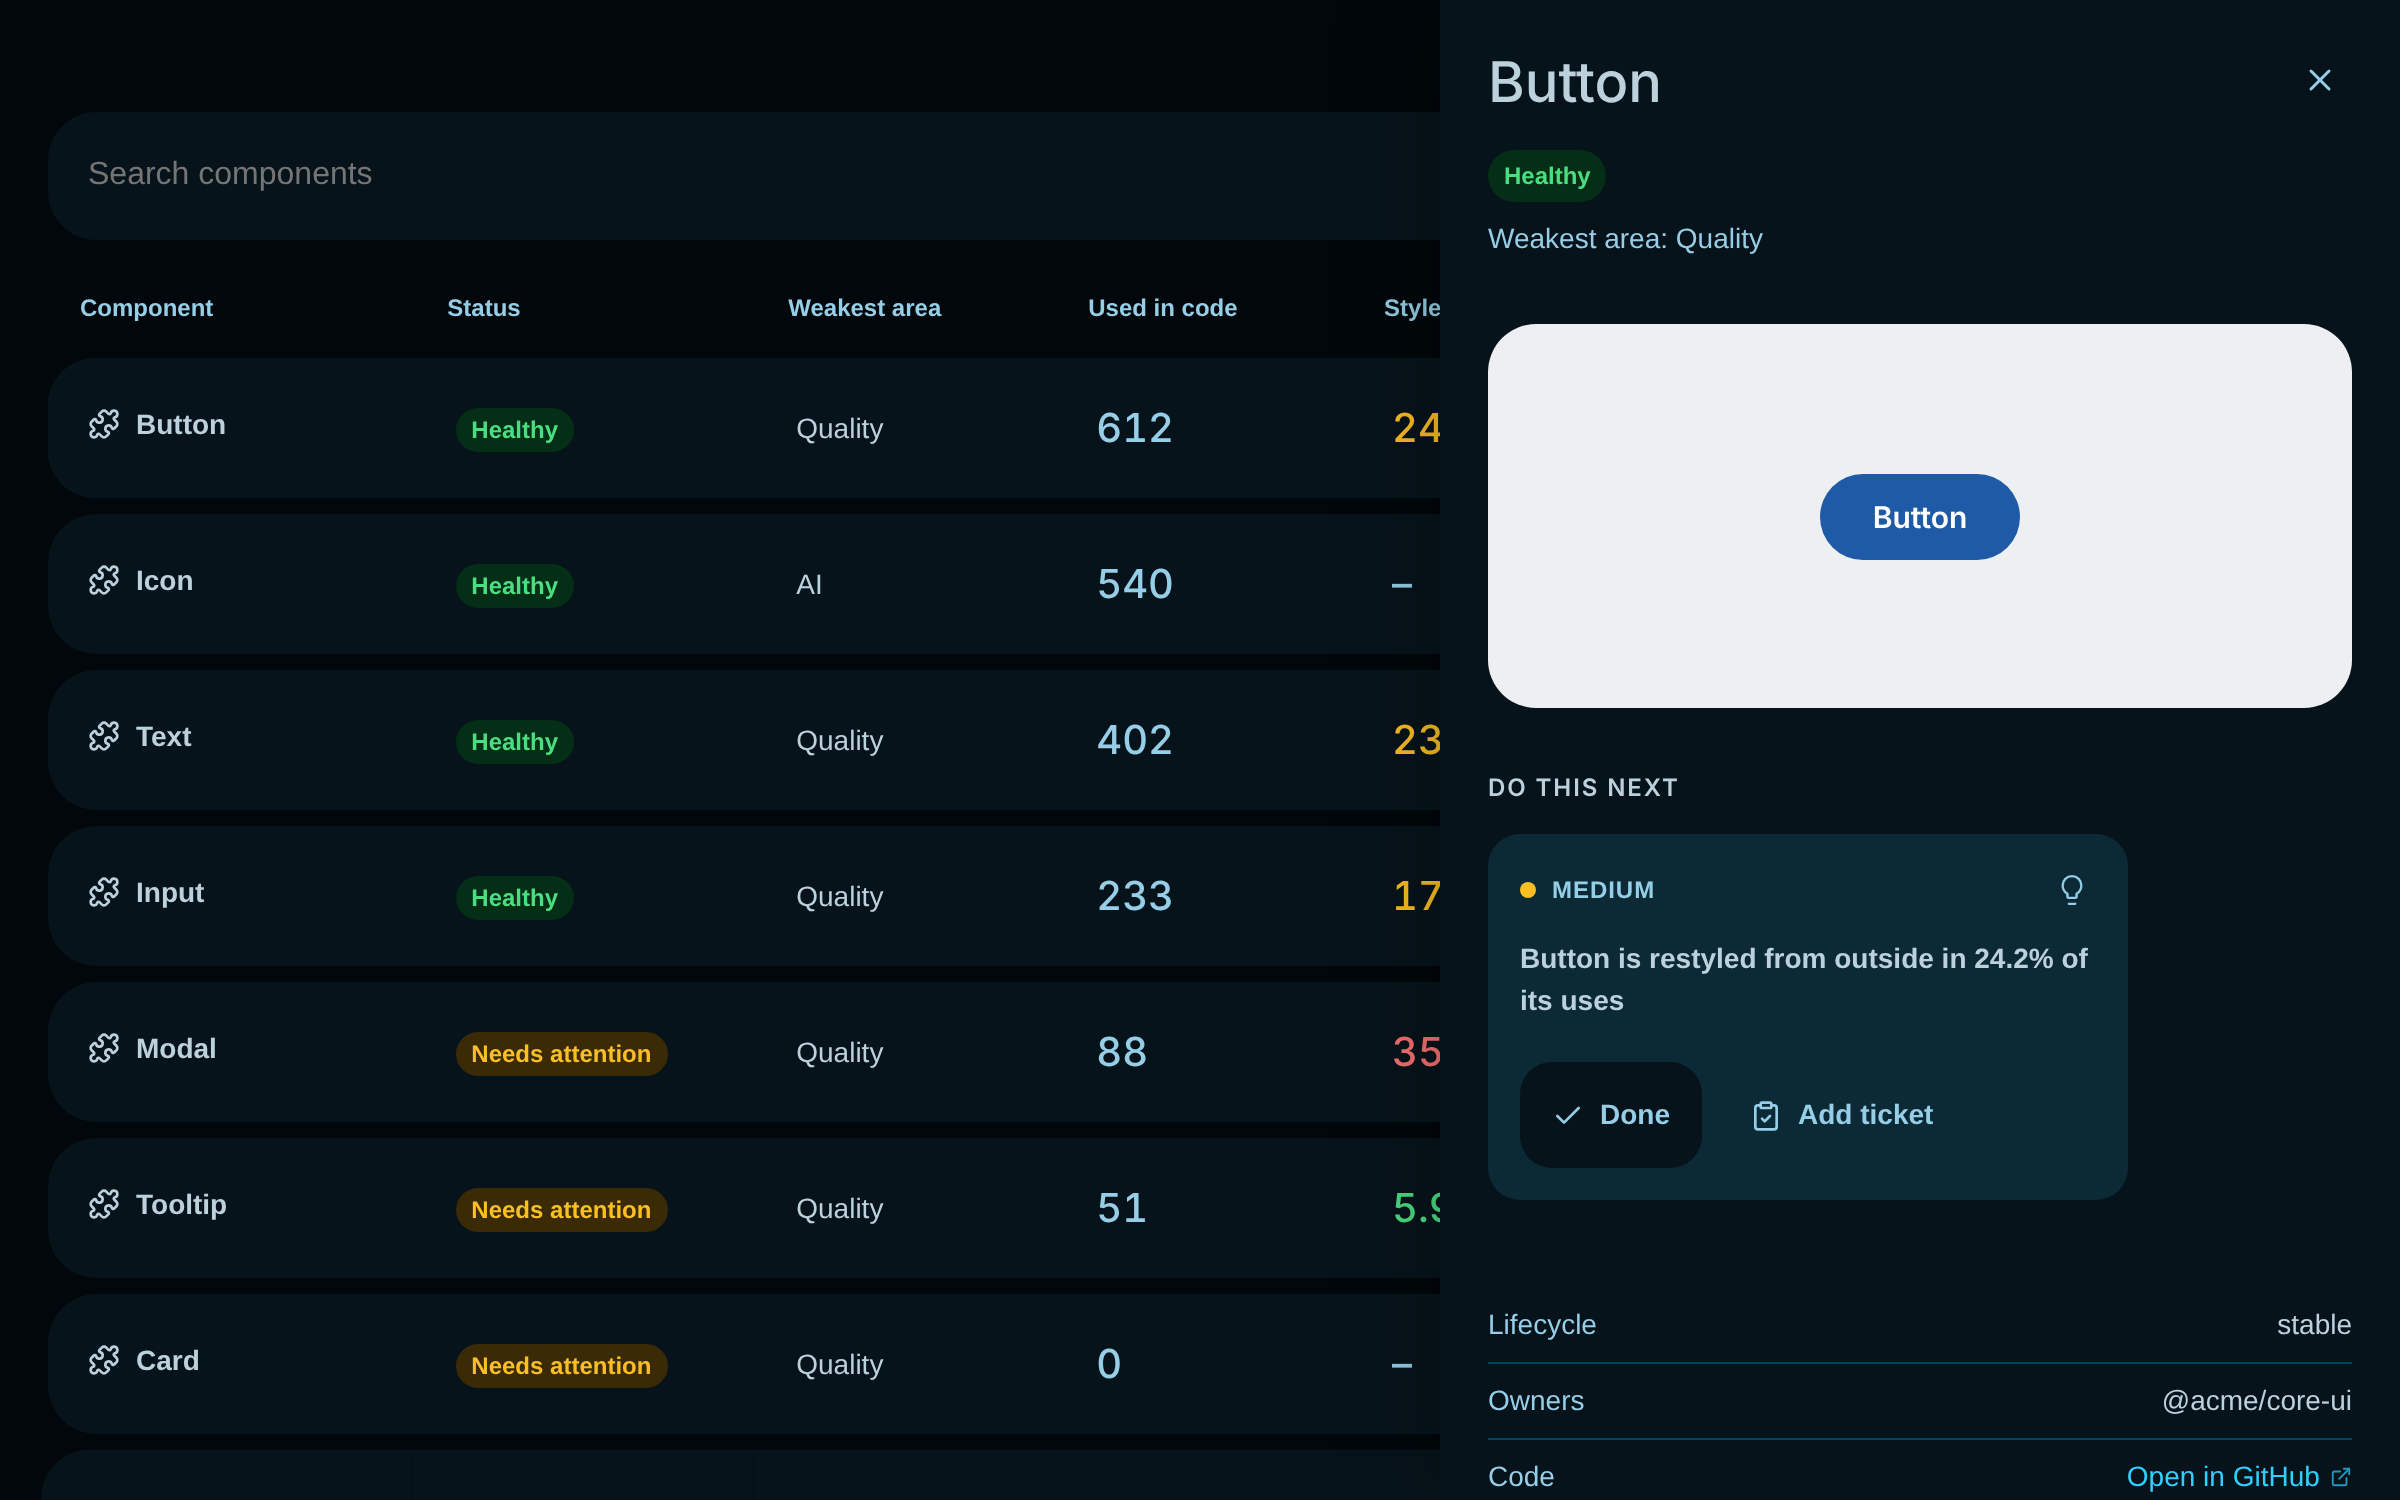
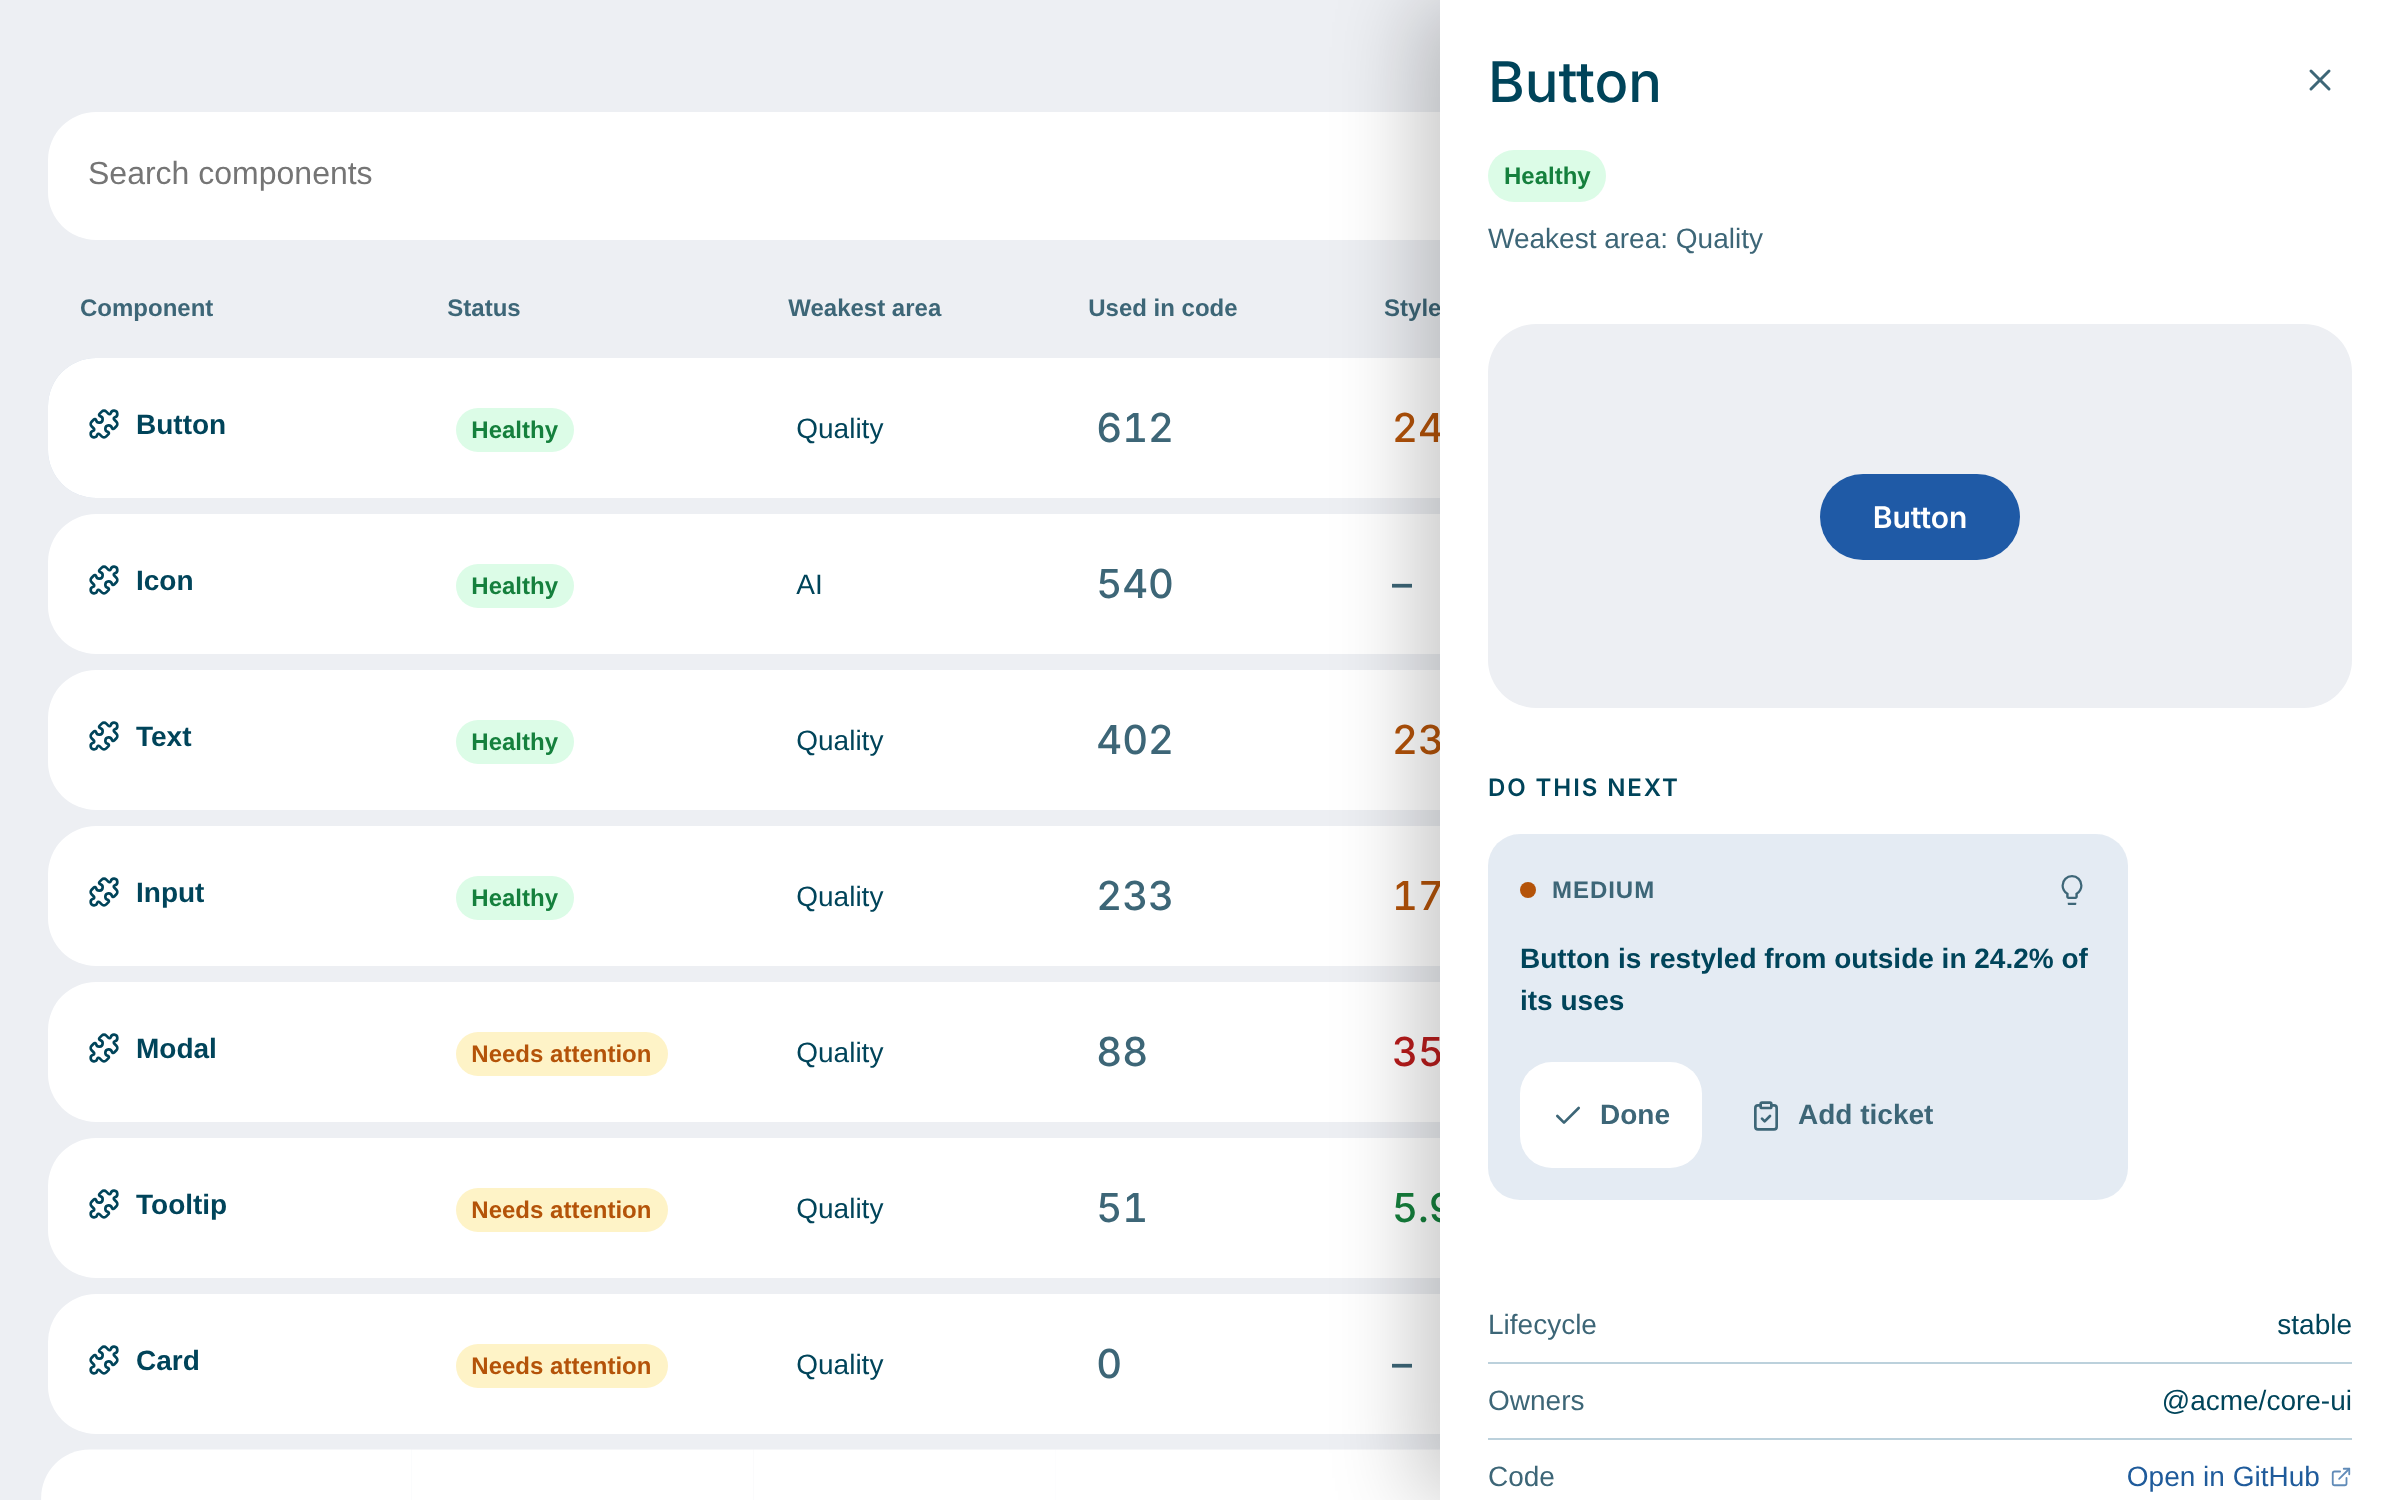
Your whole design system in one list: how healthy each component is, how much it is used in code, how often it is restyled or detached in Figma, whether it is documented, and what to improve first.
05 / AI-readiness
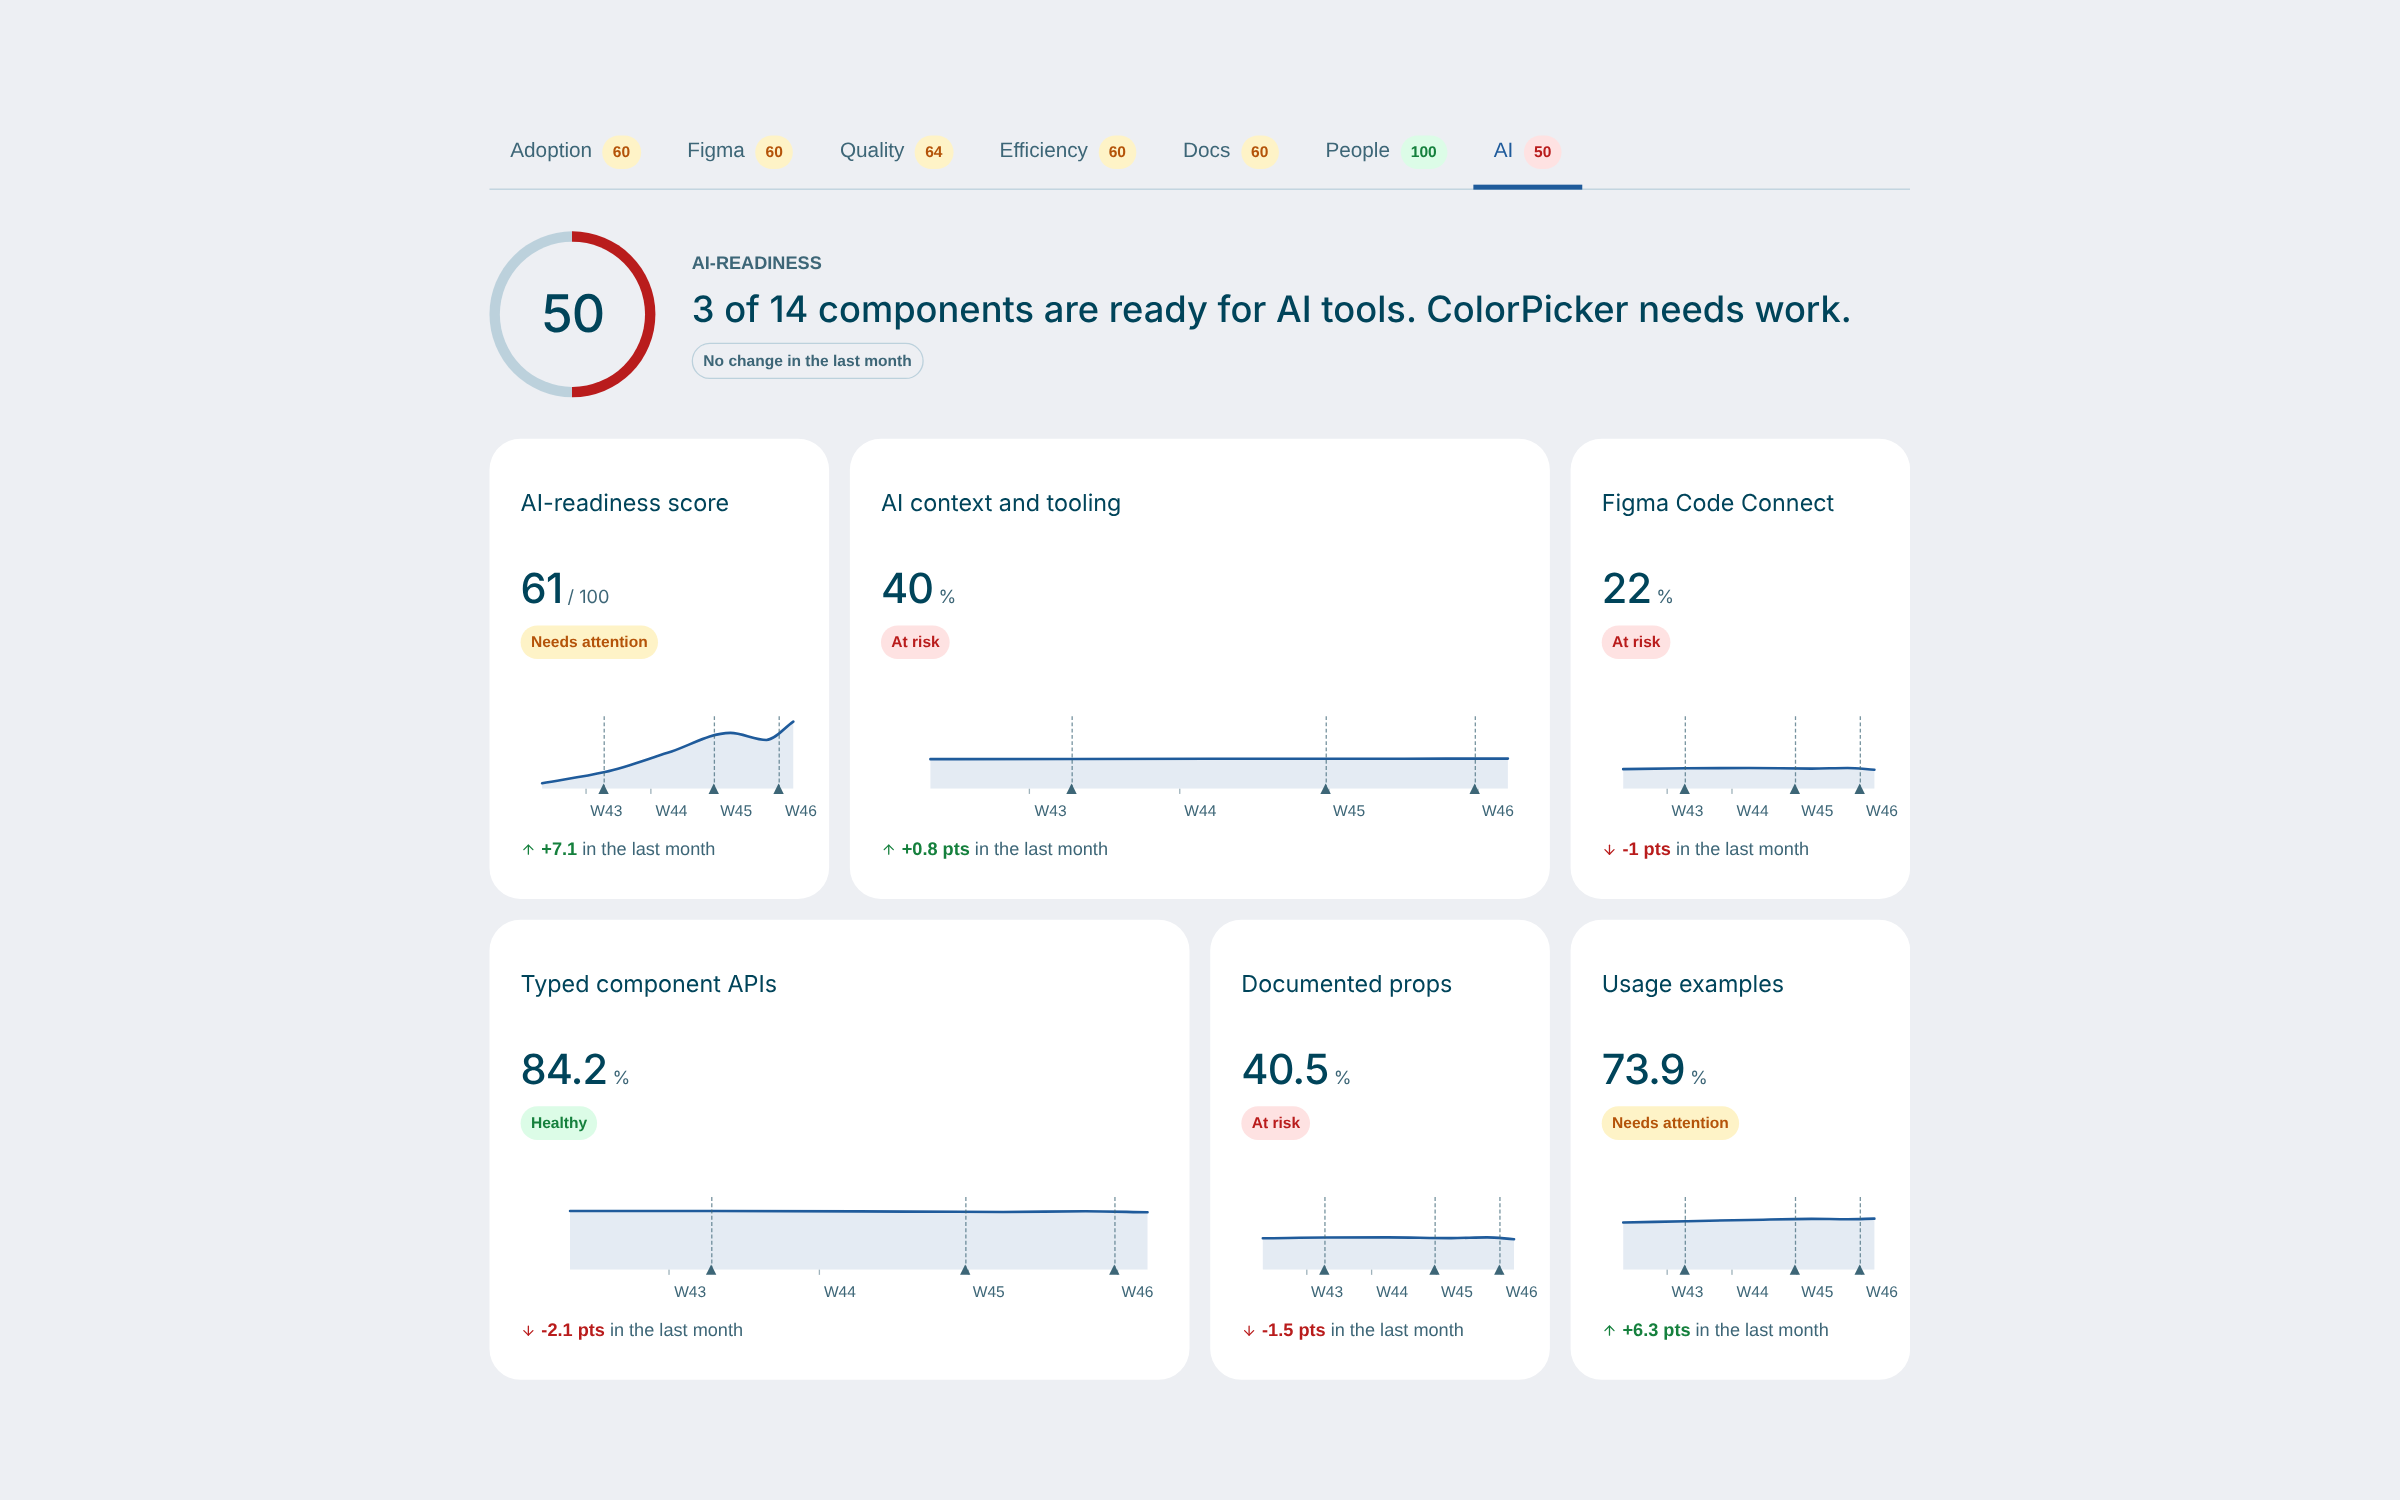
AI-readiness is a vital like the others. Components are ranked from weakest to strongest with the reason: missing prop descriptions, no examples, unclear deprecations. Fix what makes agents guess.
06 / Report
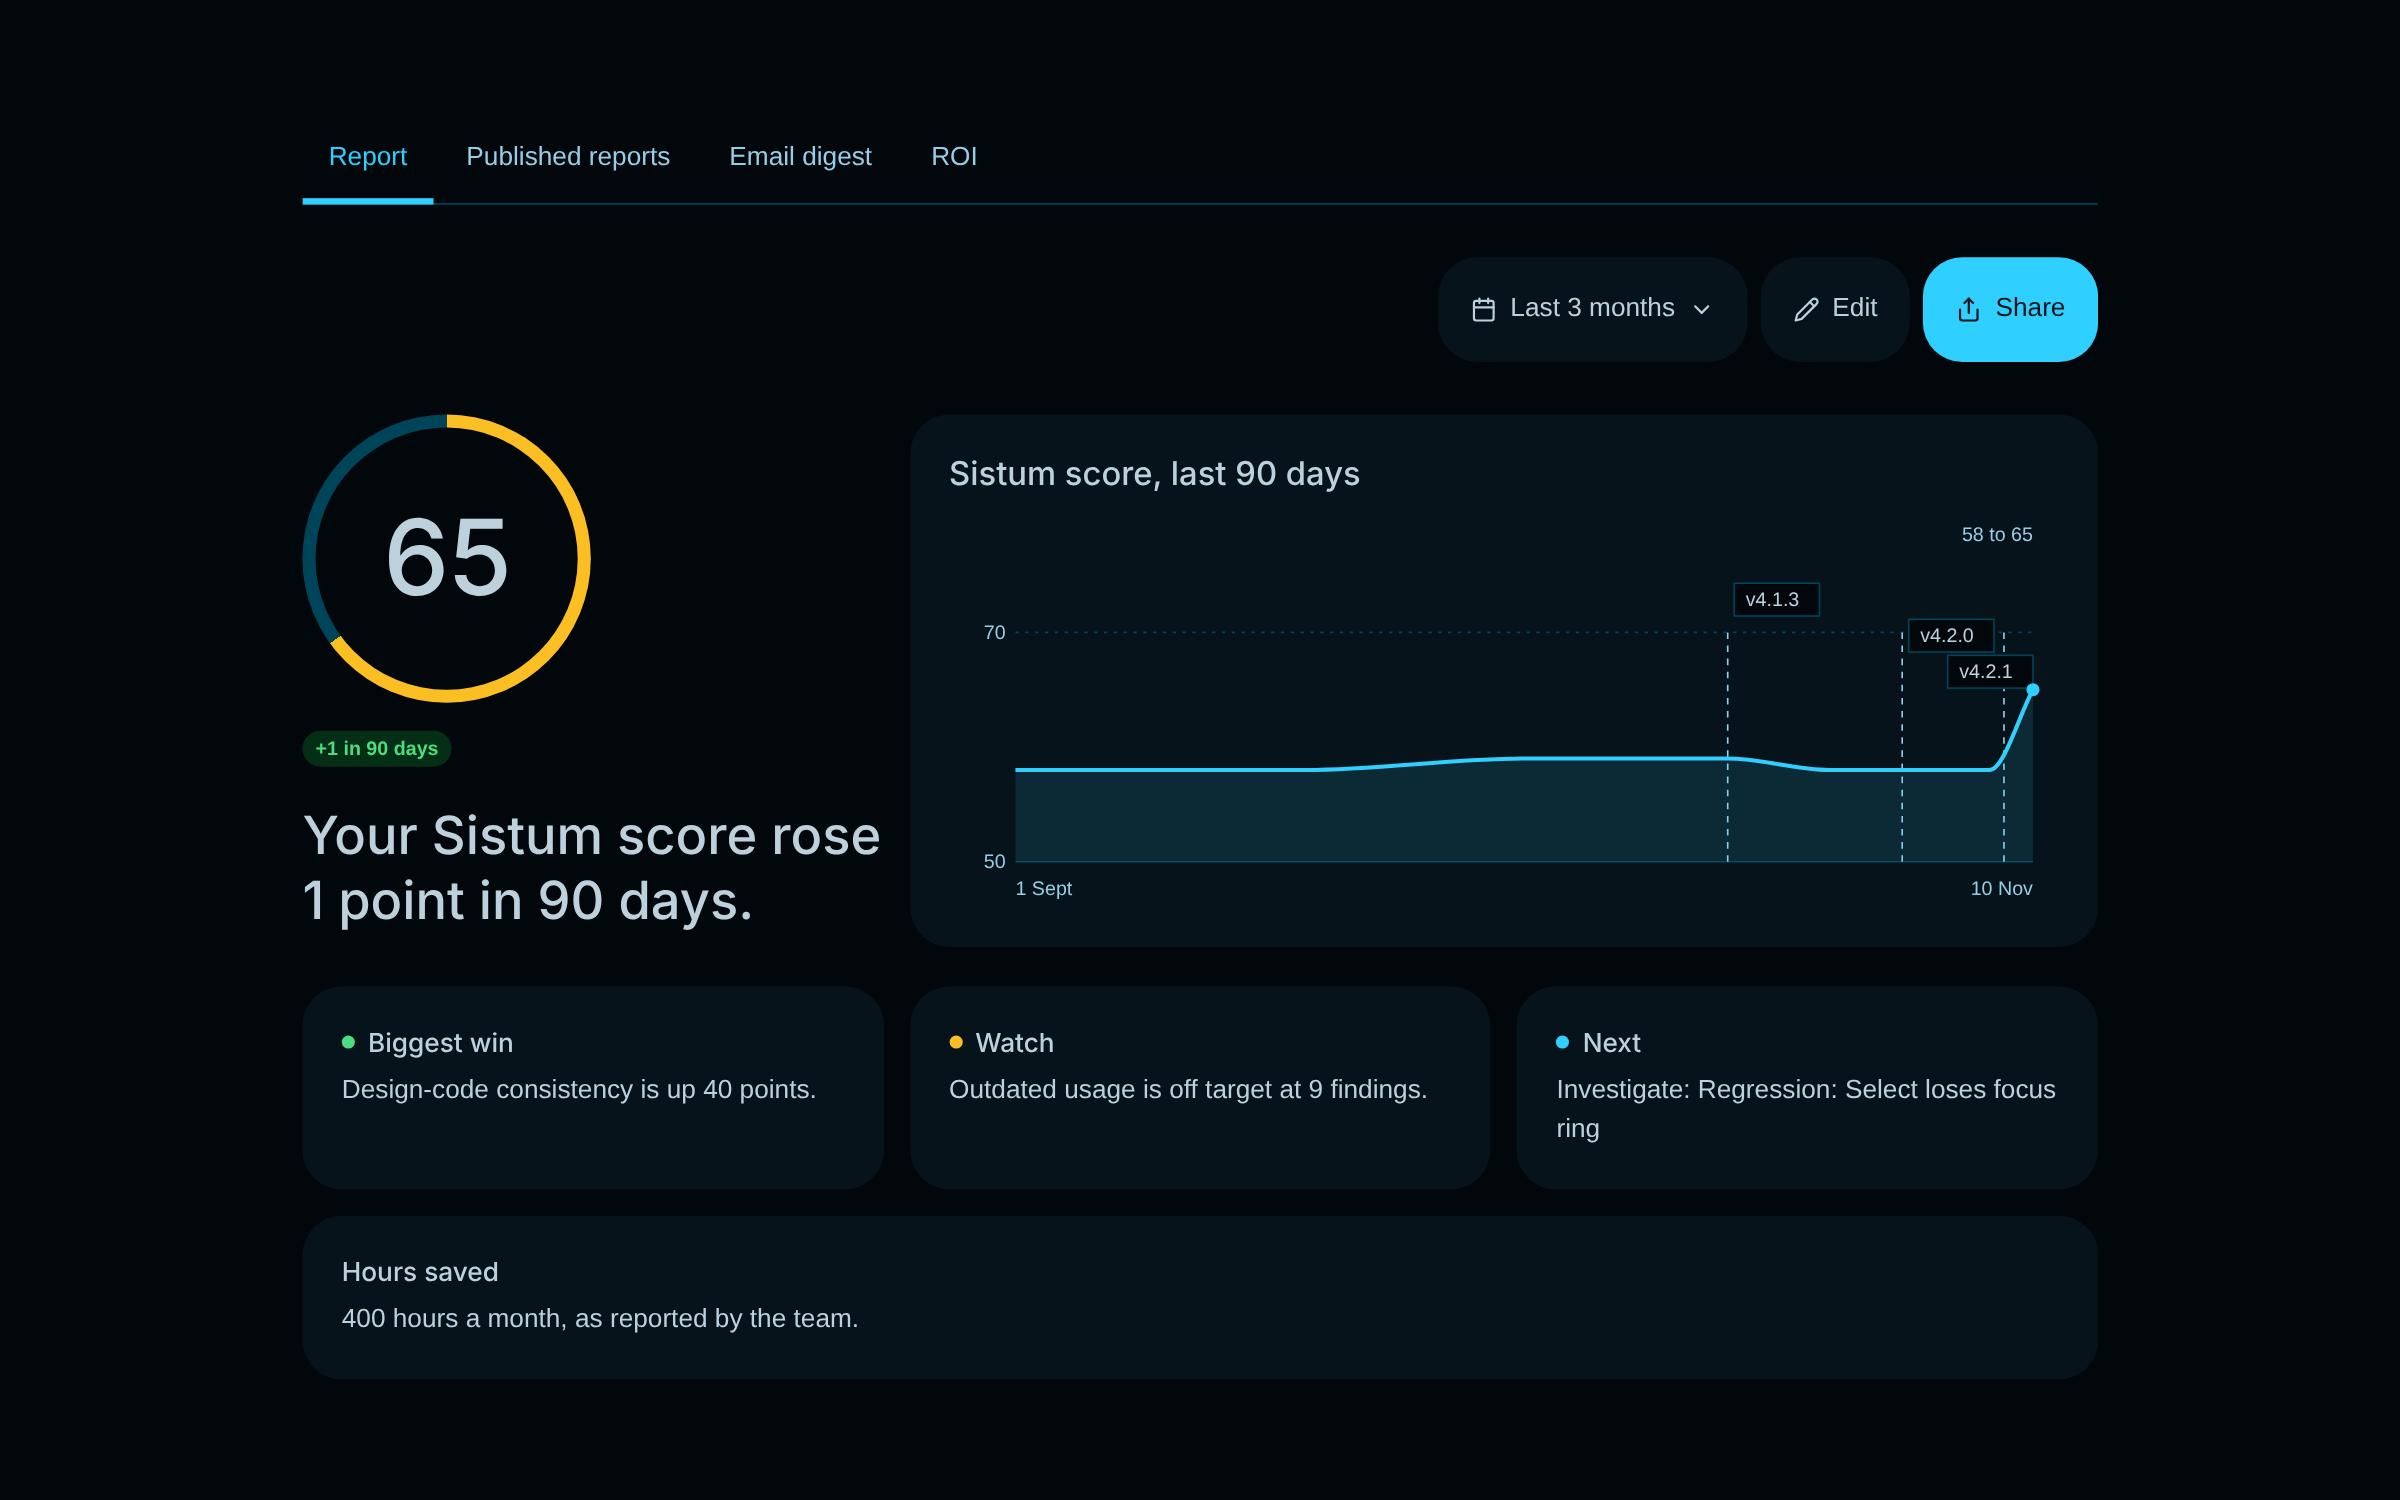
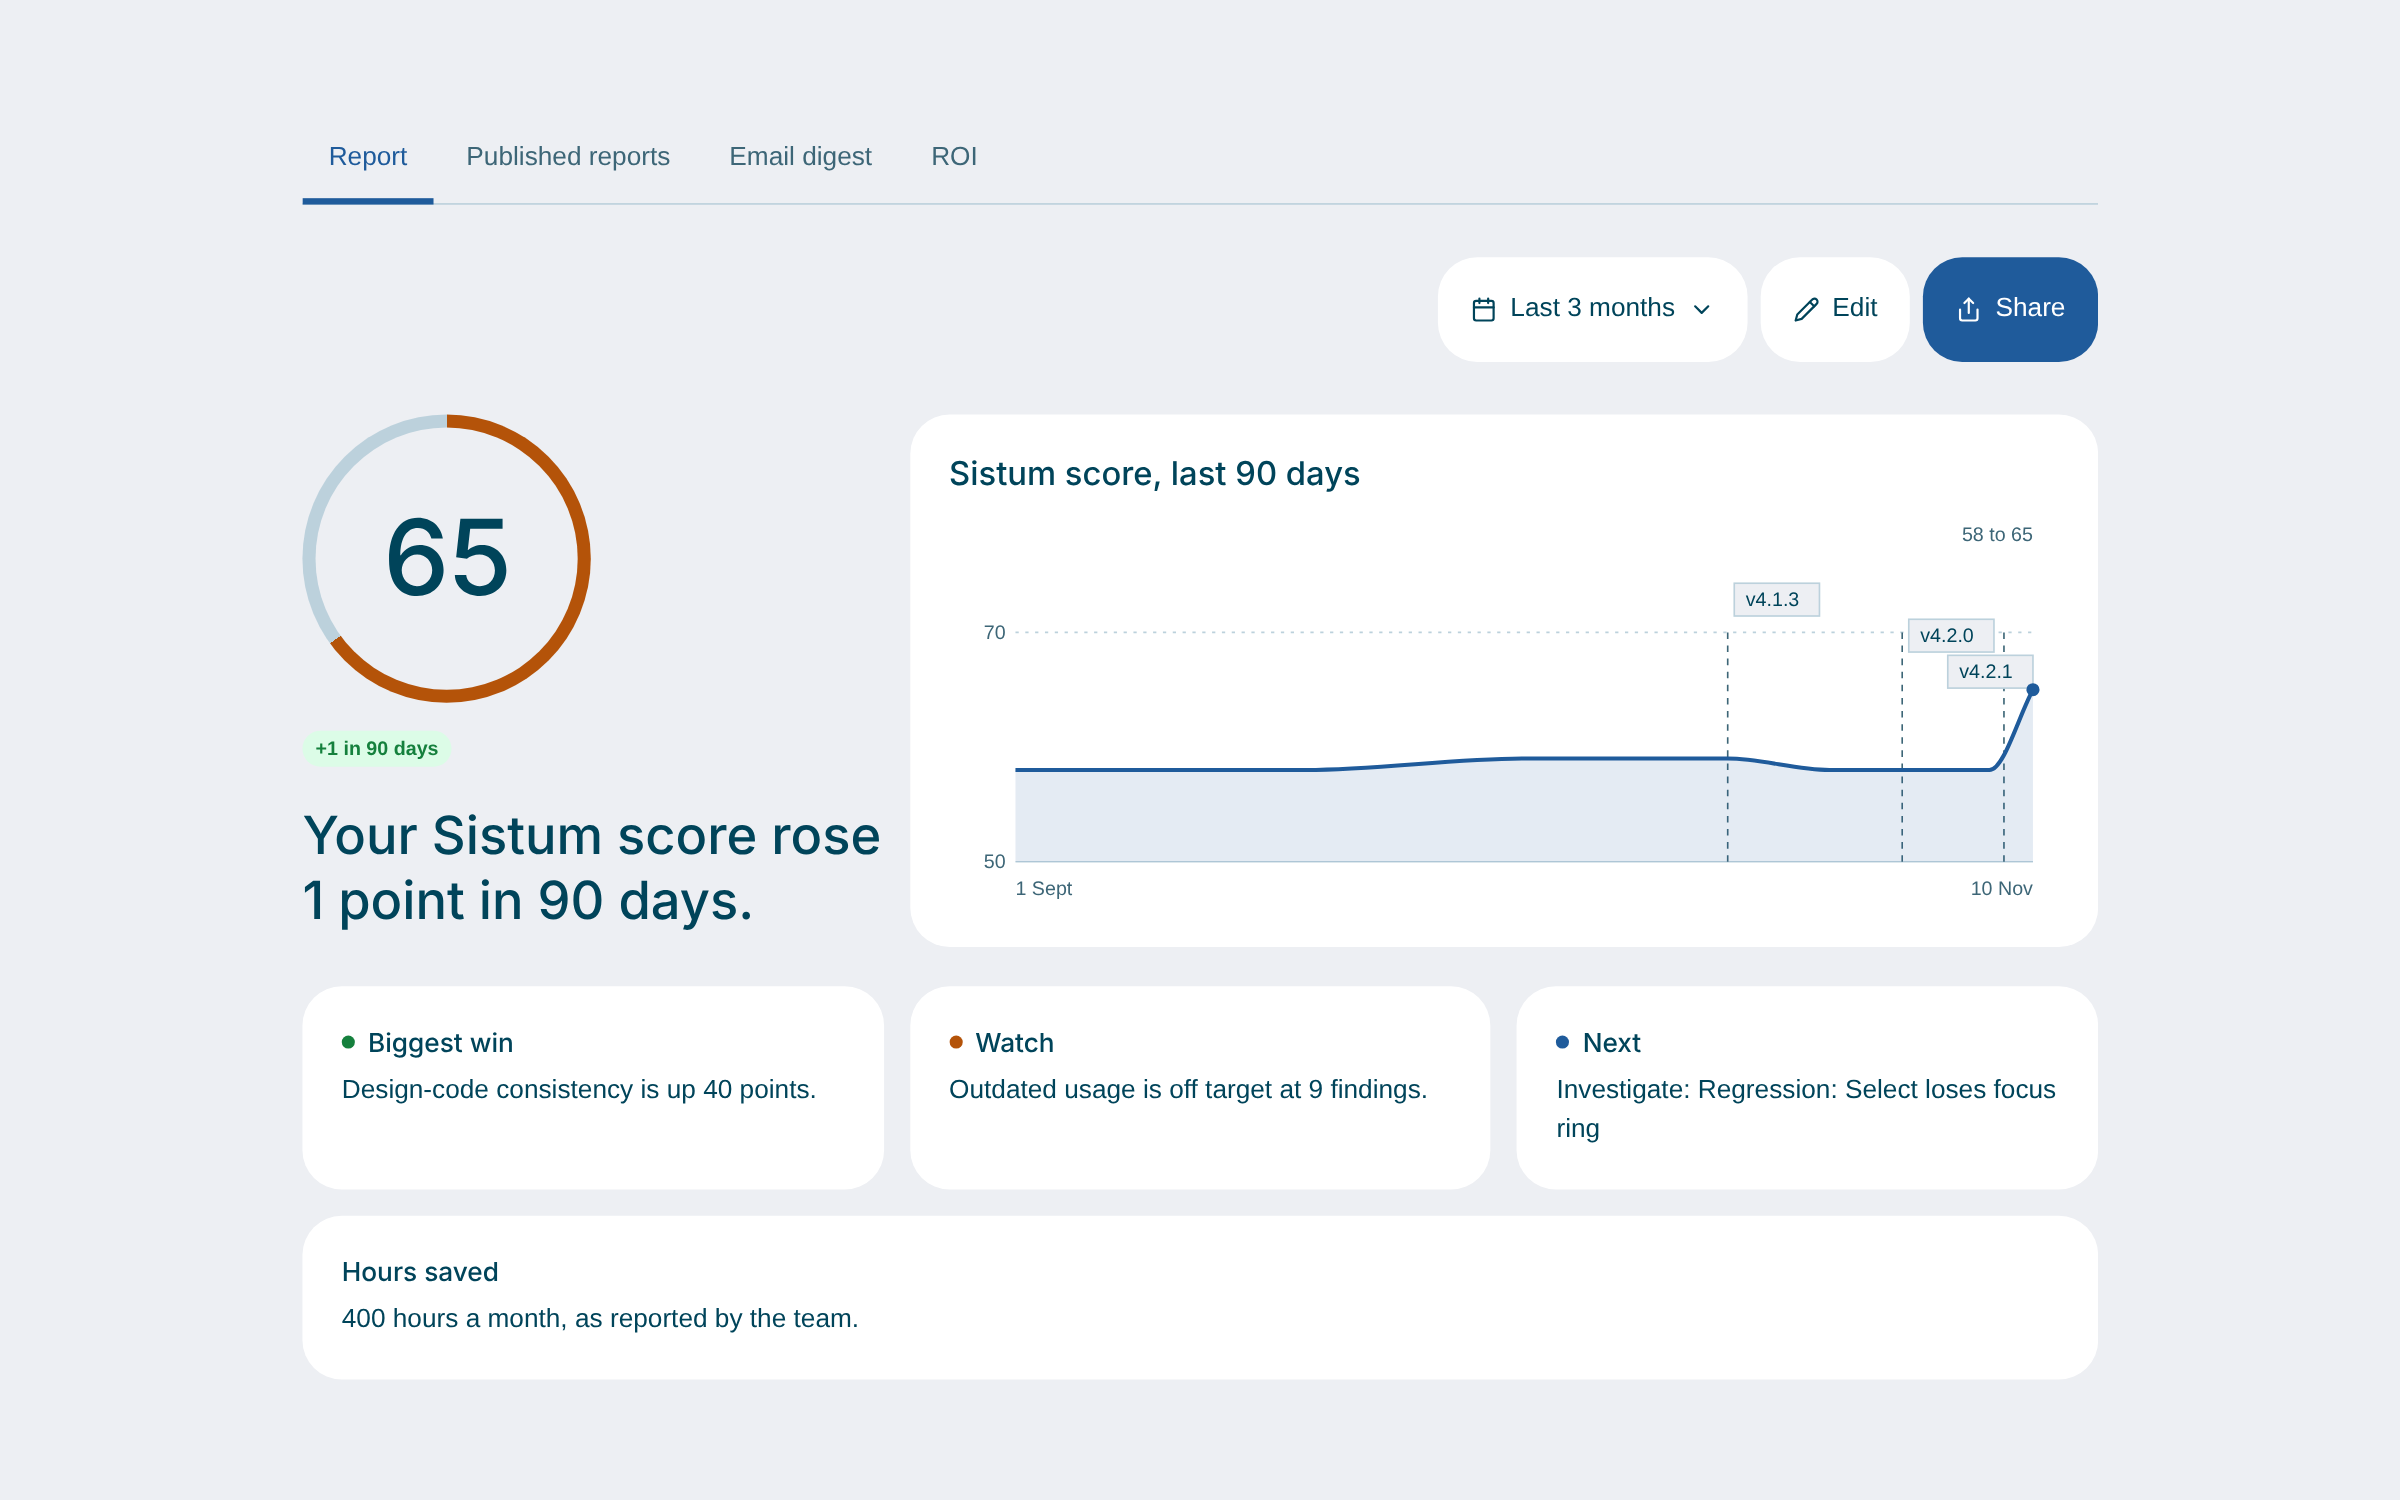
Turn the quarter into a story: one headline, the score over time with your events and releases, the biggest win, what to watch and what is next. Publish a frozen copy and share a link or a PDF.
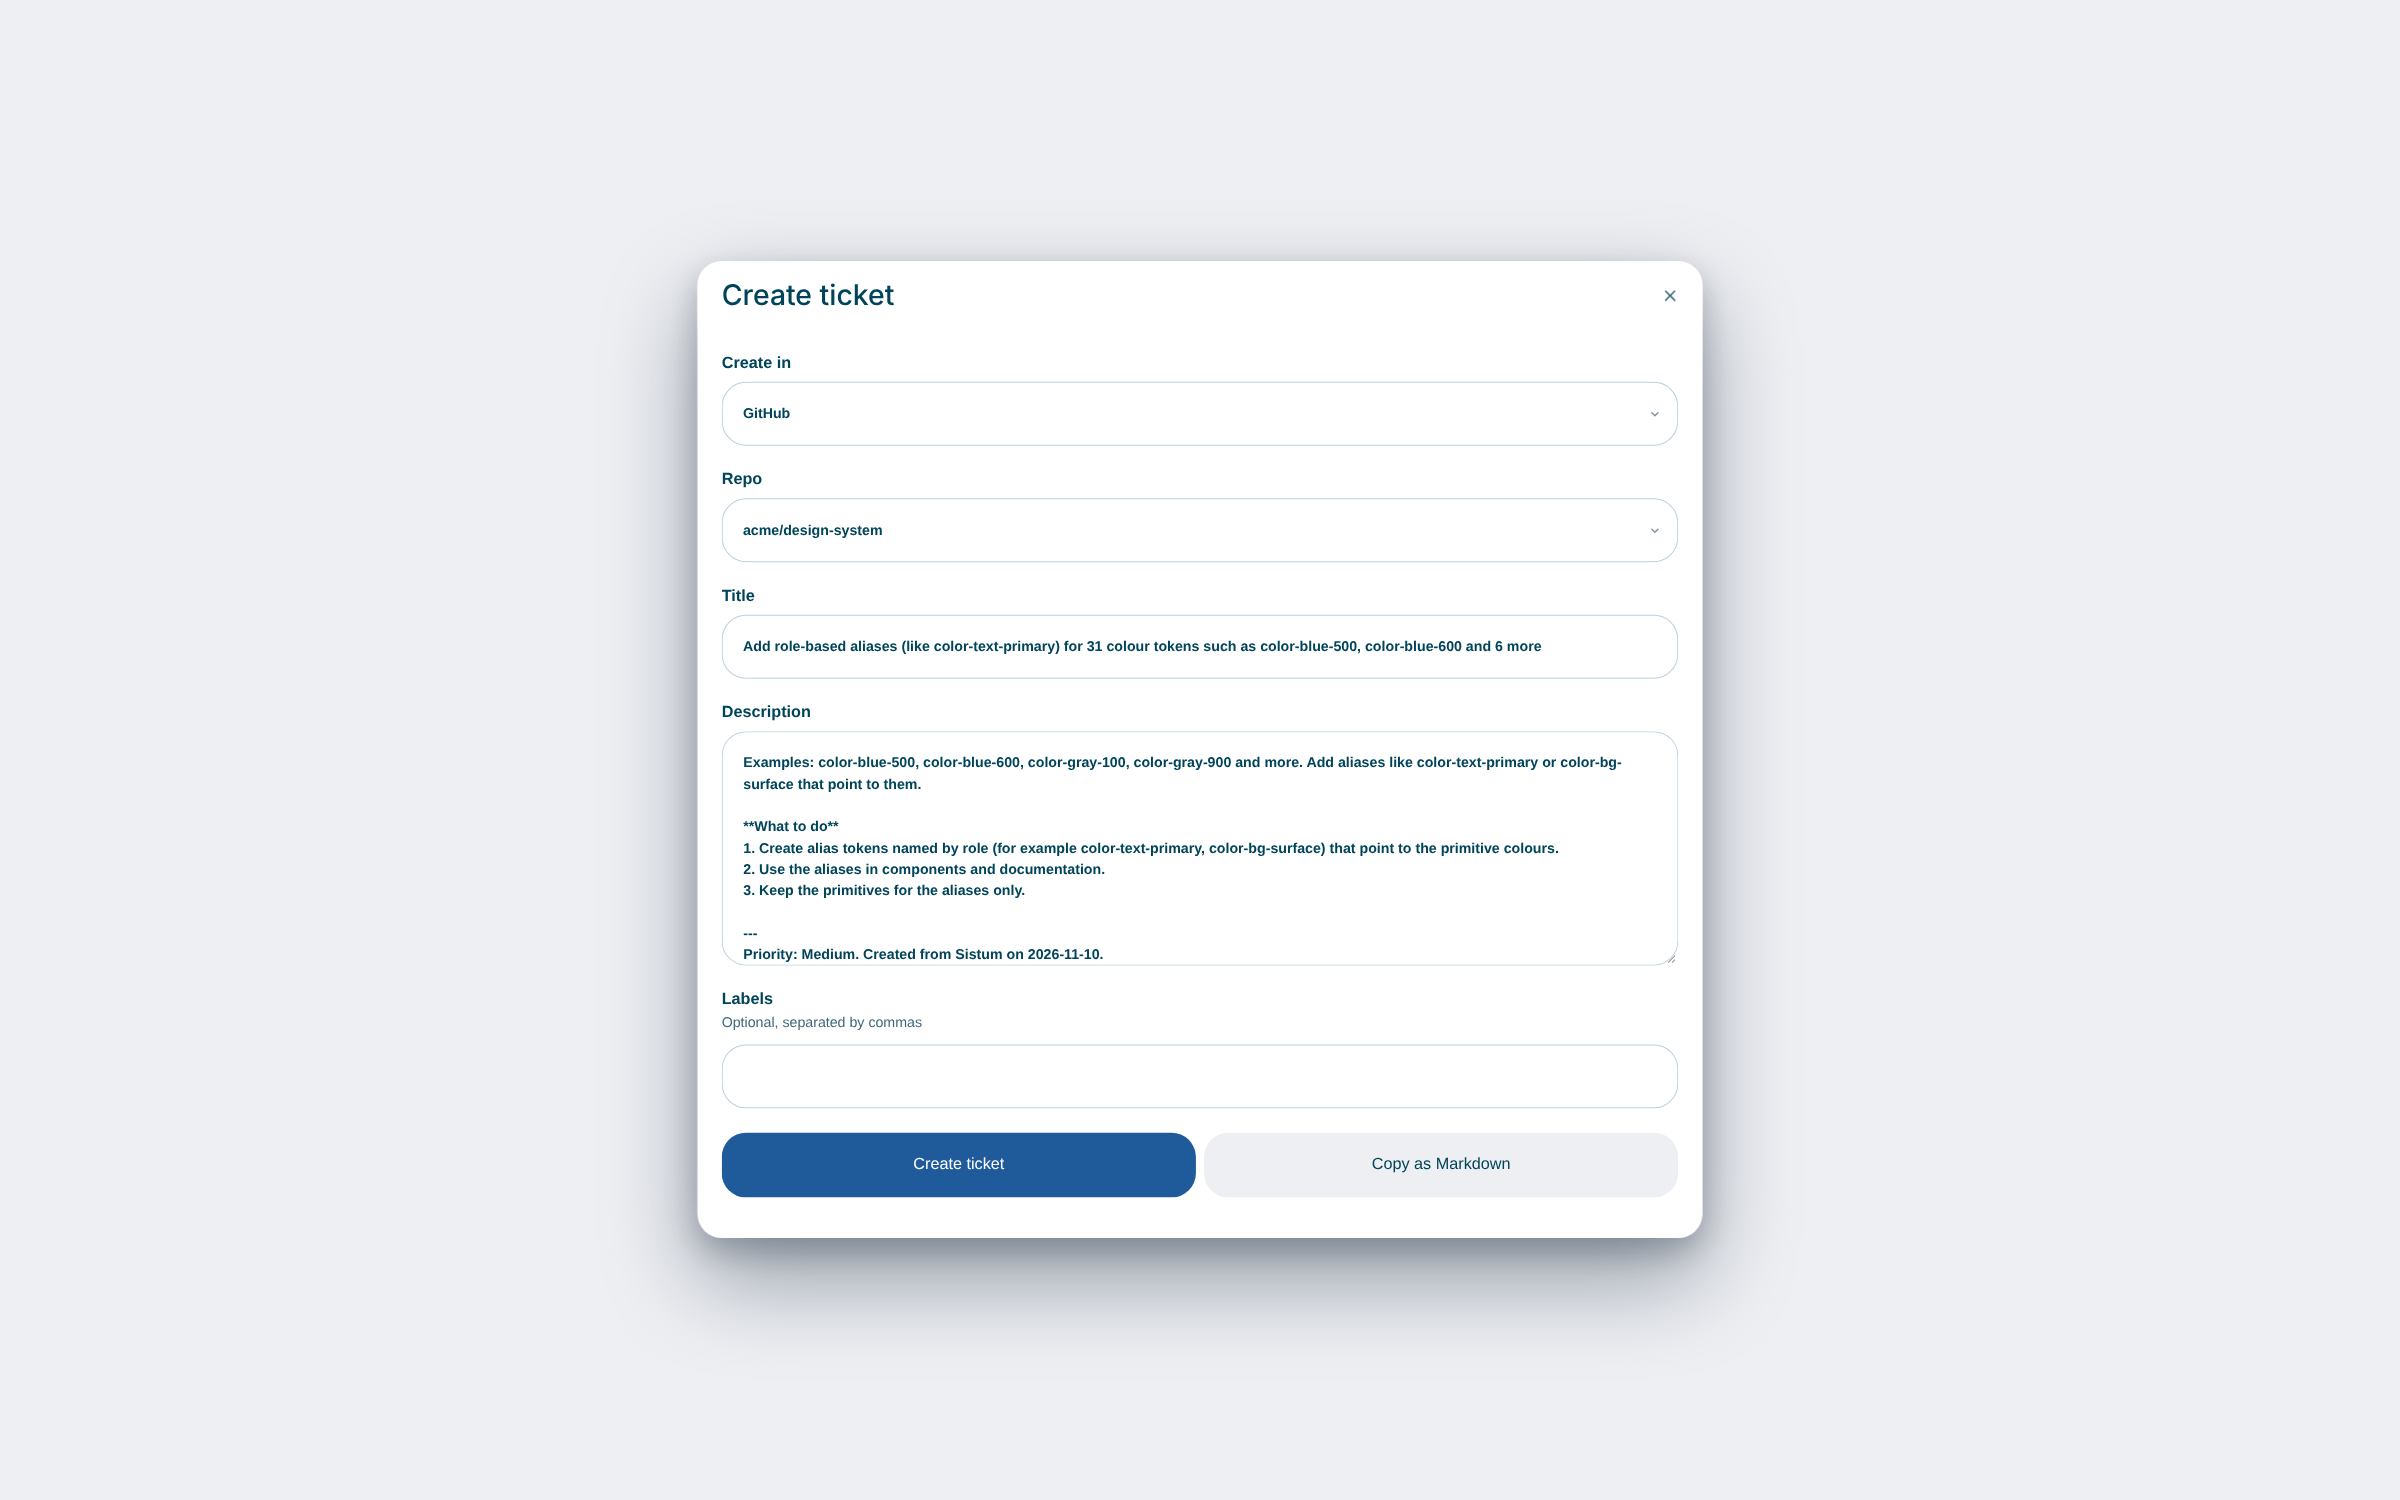
07 / Tickets
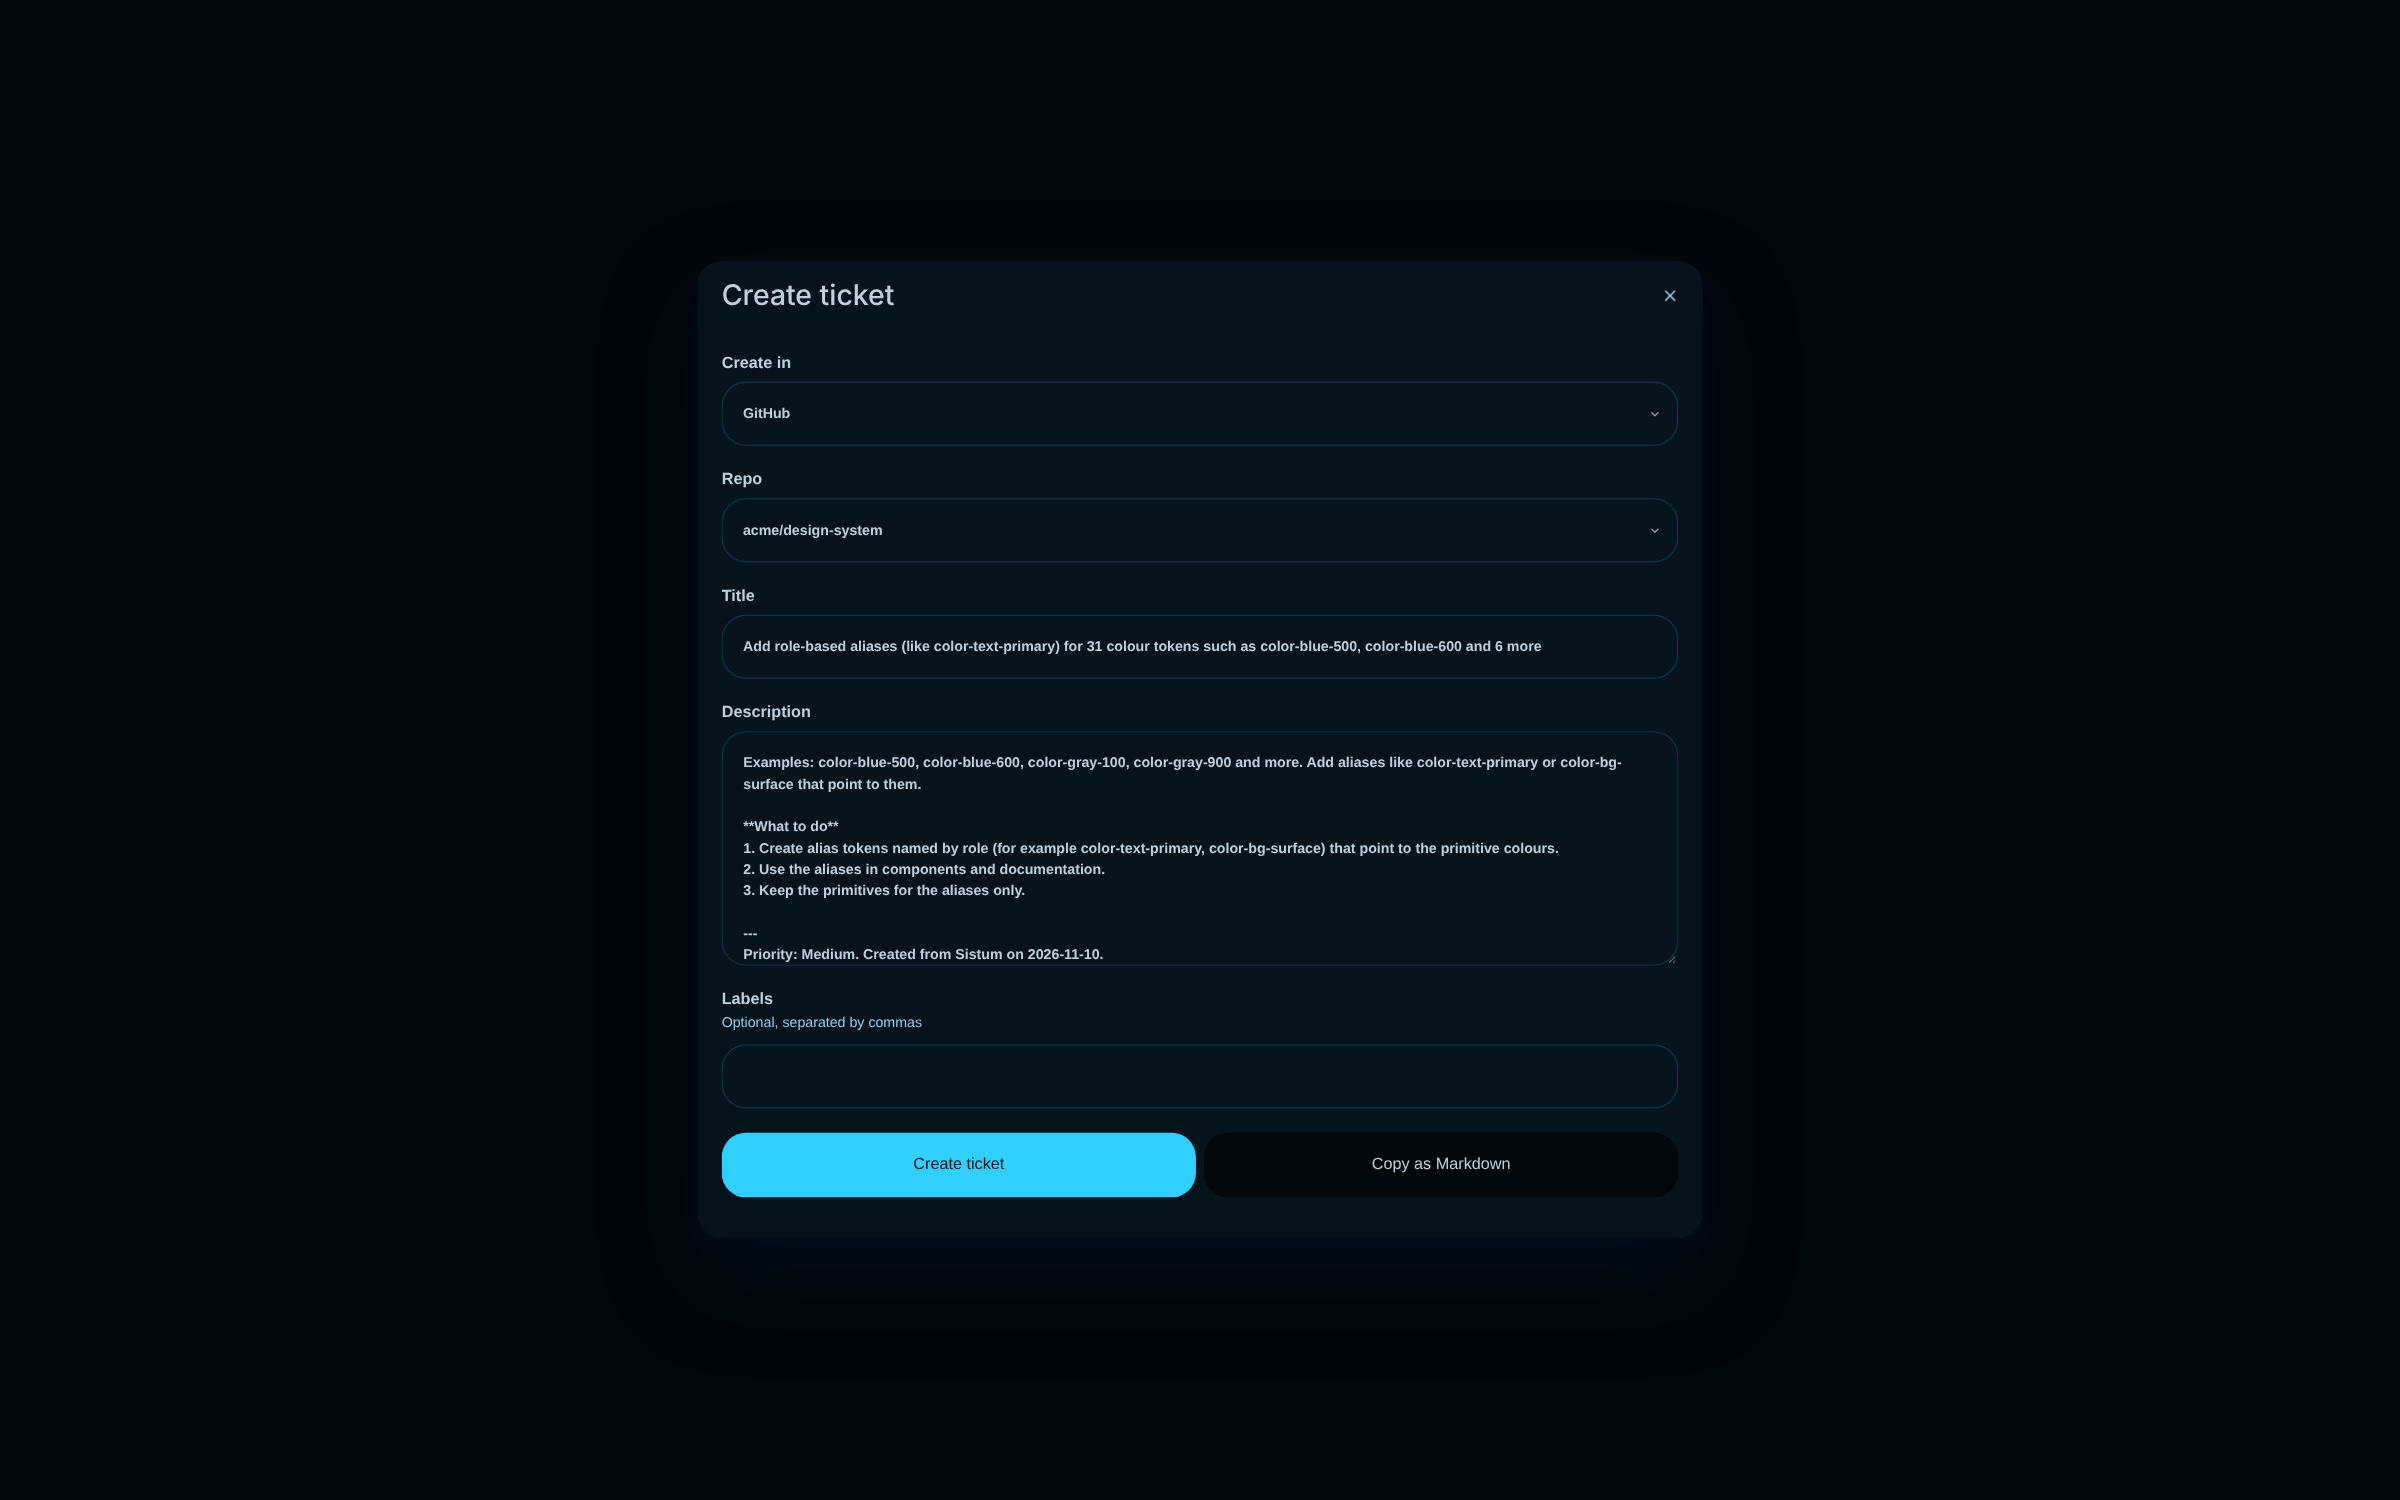
Turn any item in Do this next into an issue where your team already works: GitHub, GitLab, Bitbucket, Jira or Linear. Sistum writes the title and the evidence, you pick the destination.
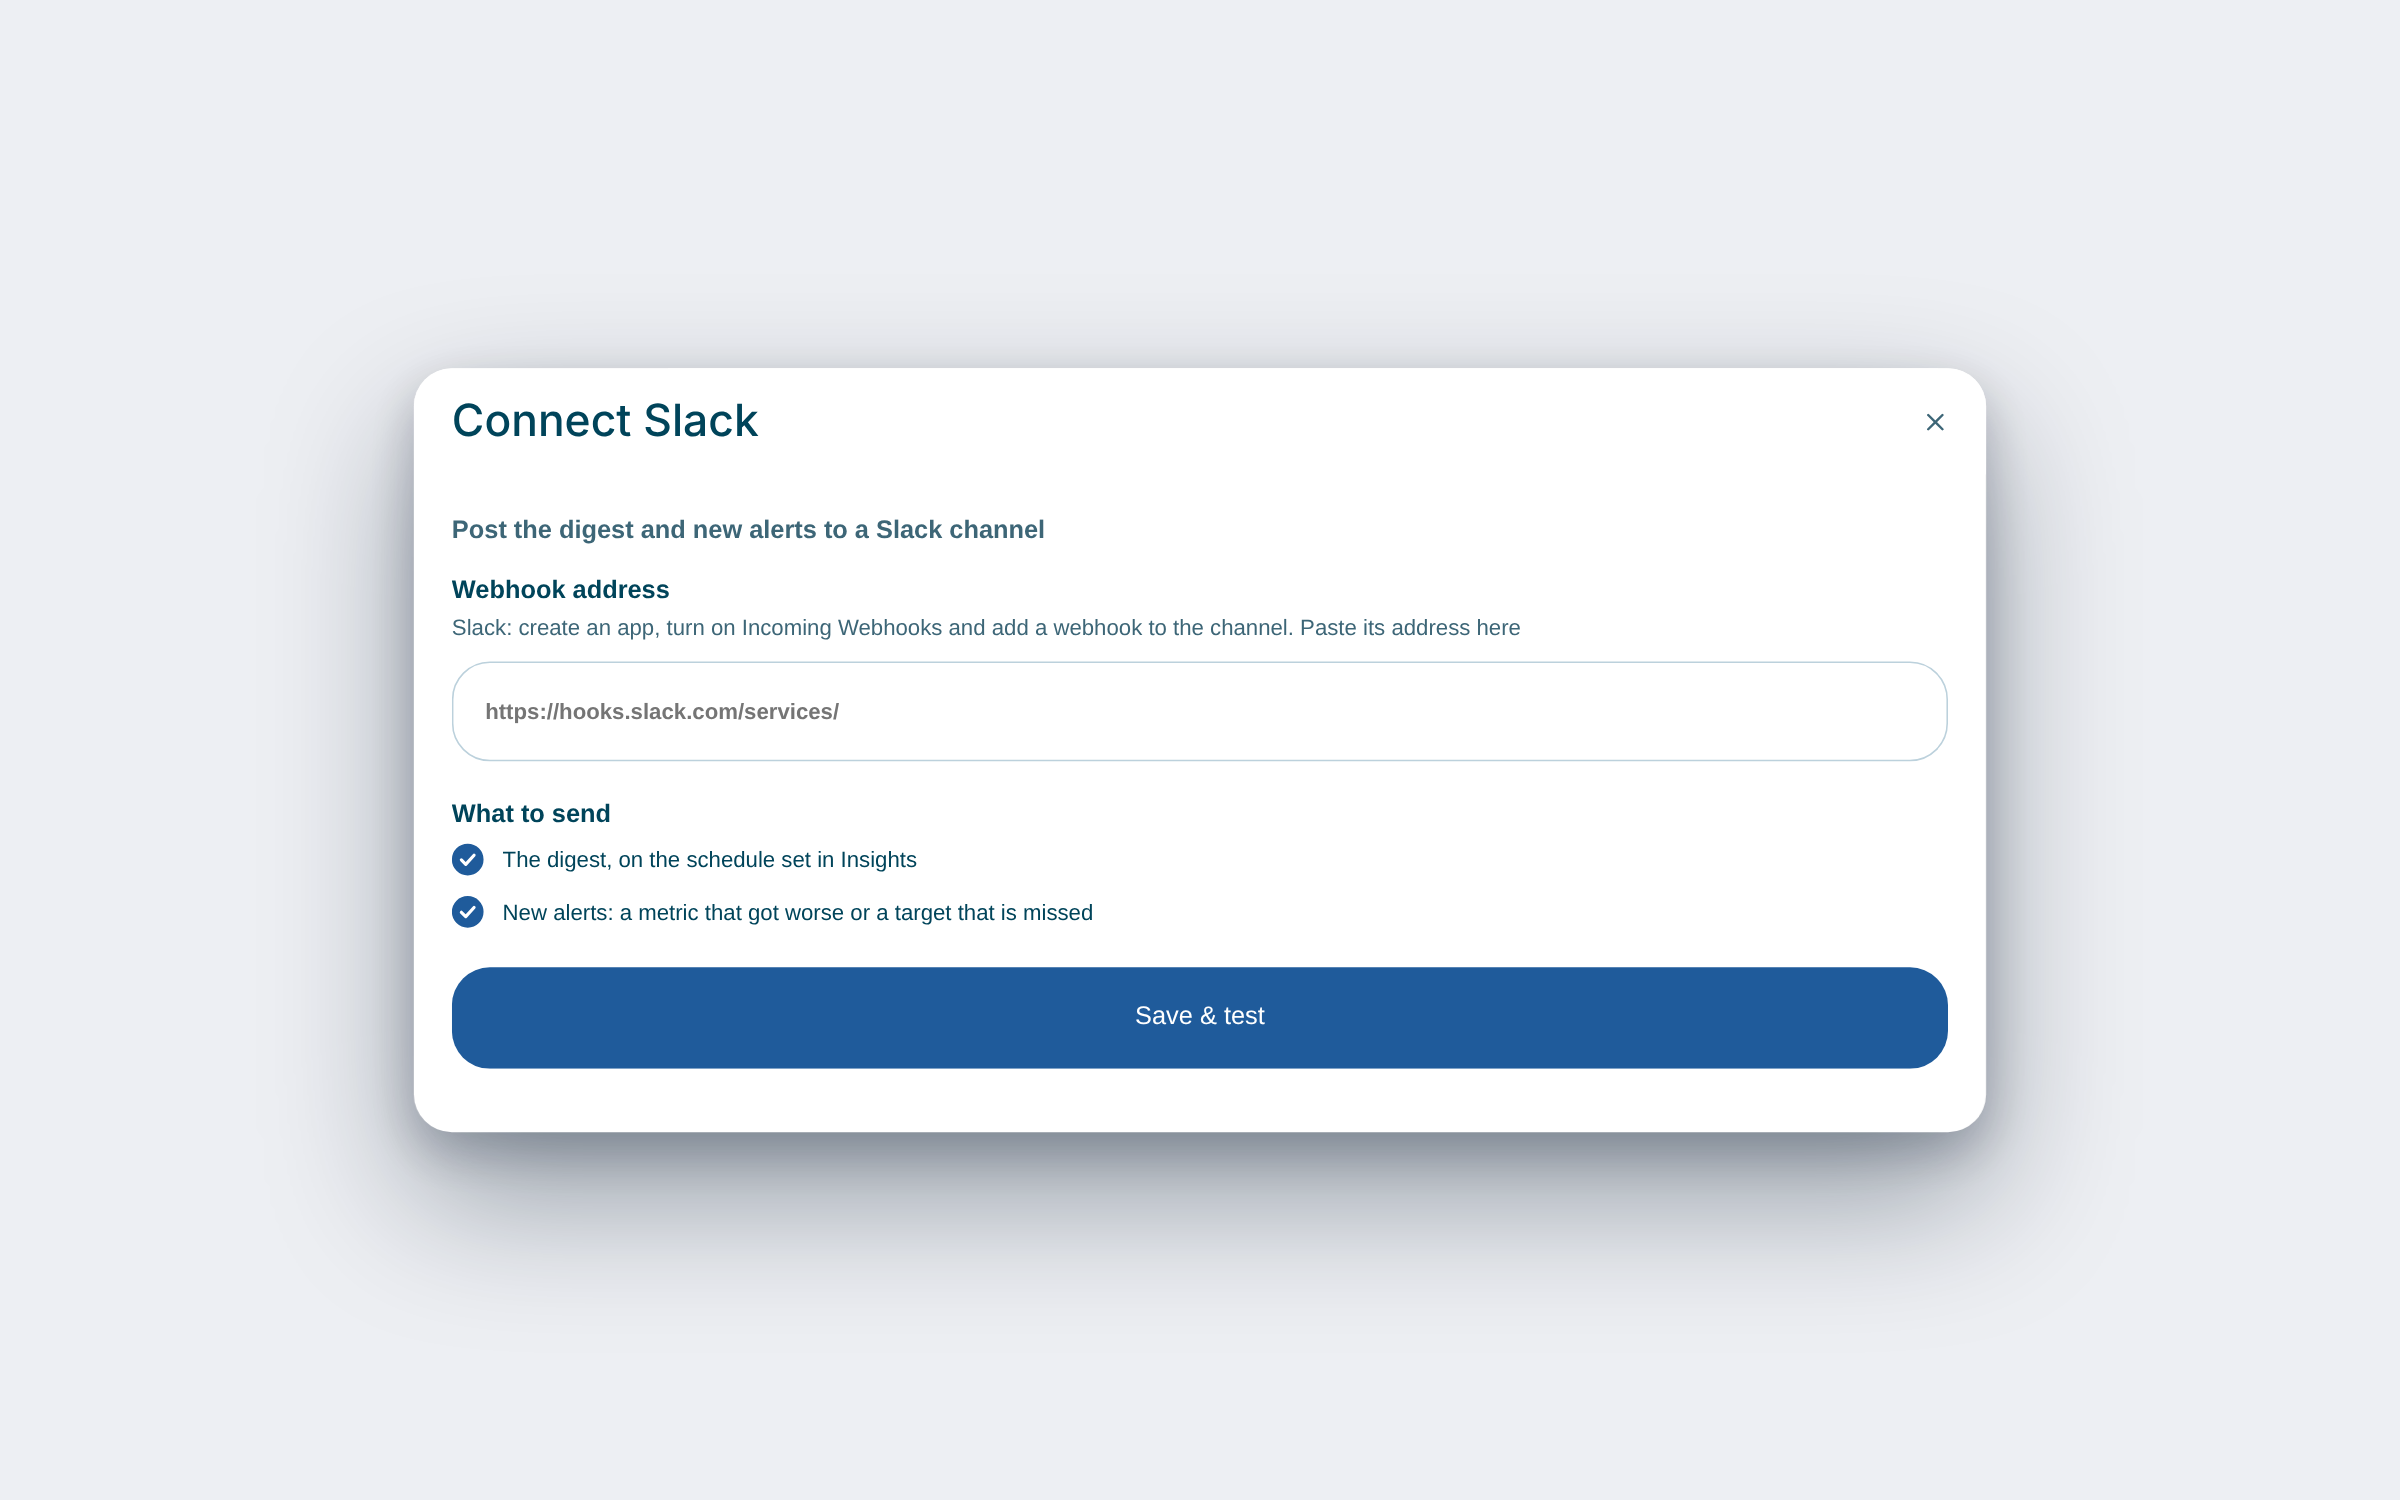
08 / Alerts
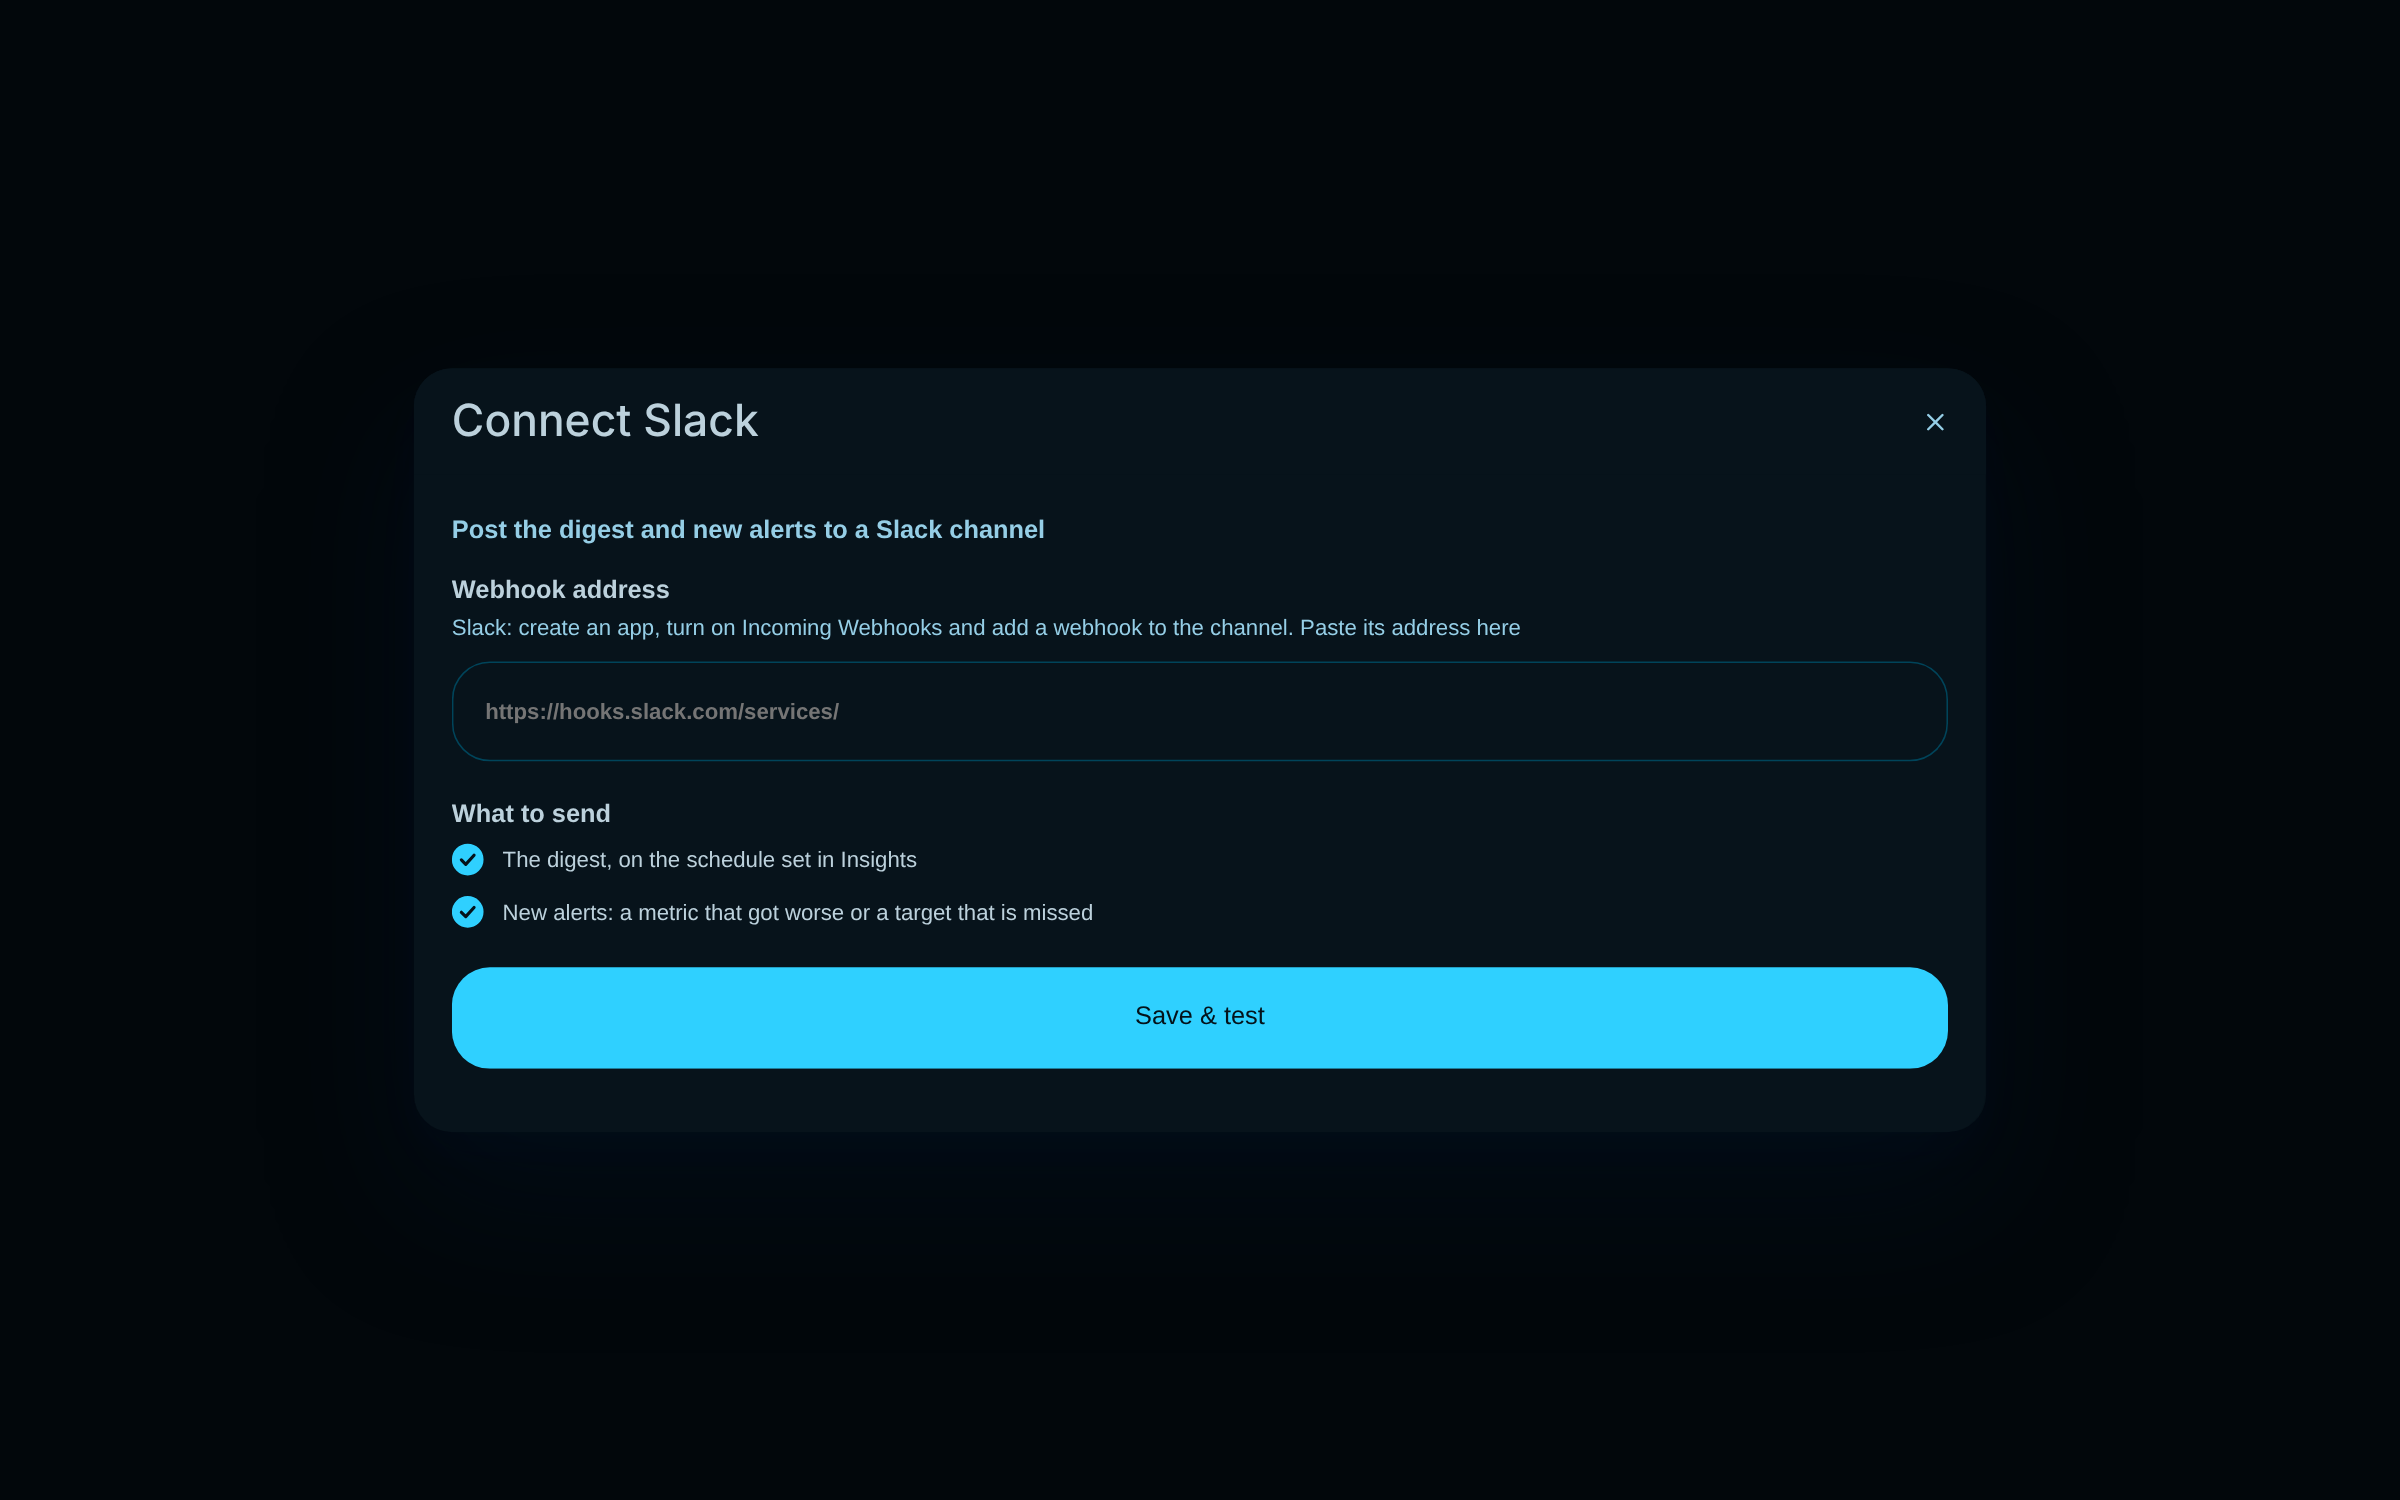
Send the digest and new alerts to a Slack or Teams channel, or to a signed webhook of your own. Choose what goes out, and Sistum only ever sends: nothing is read back from your chat.
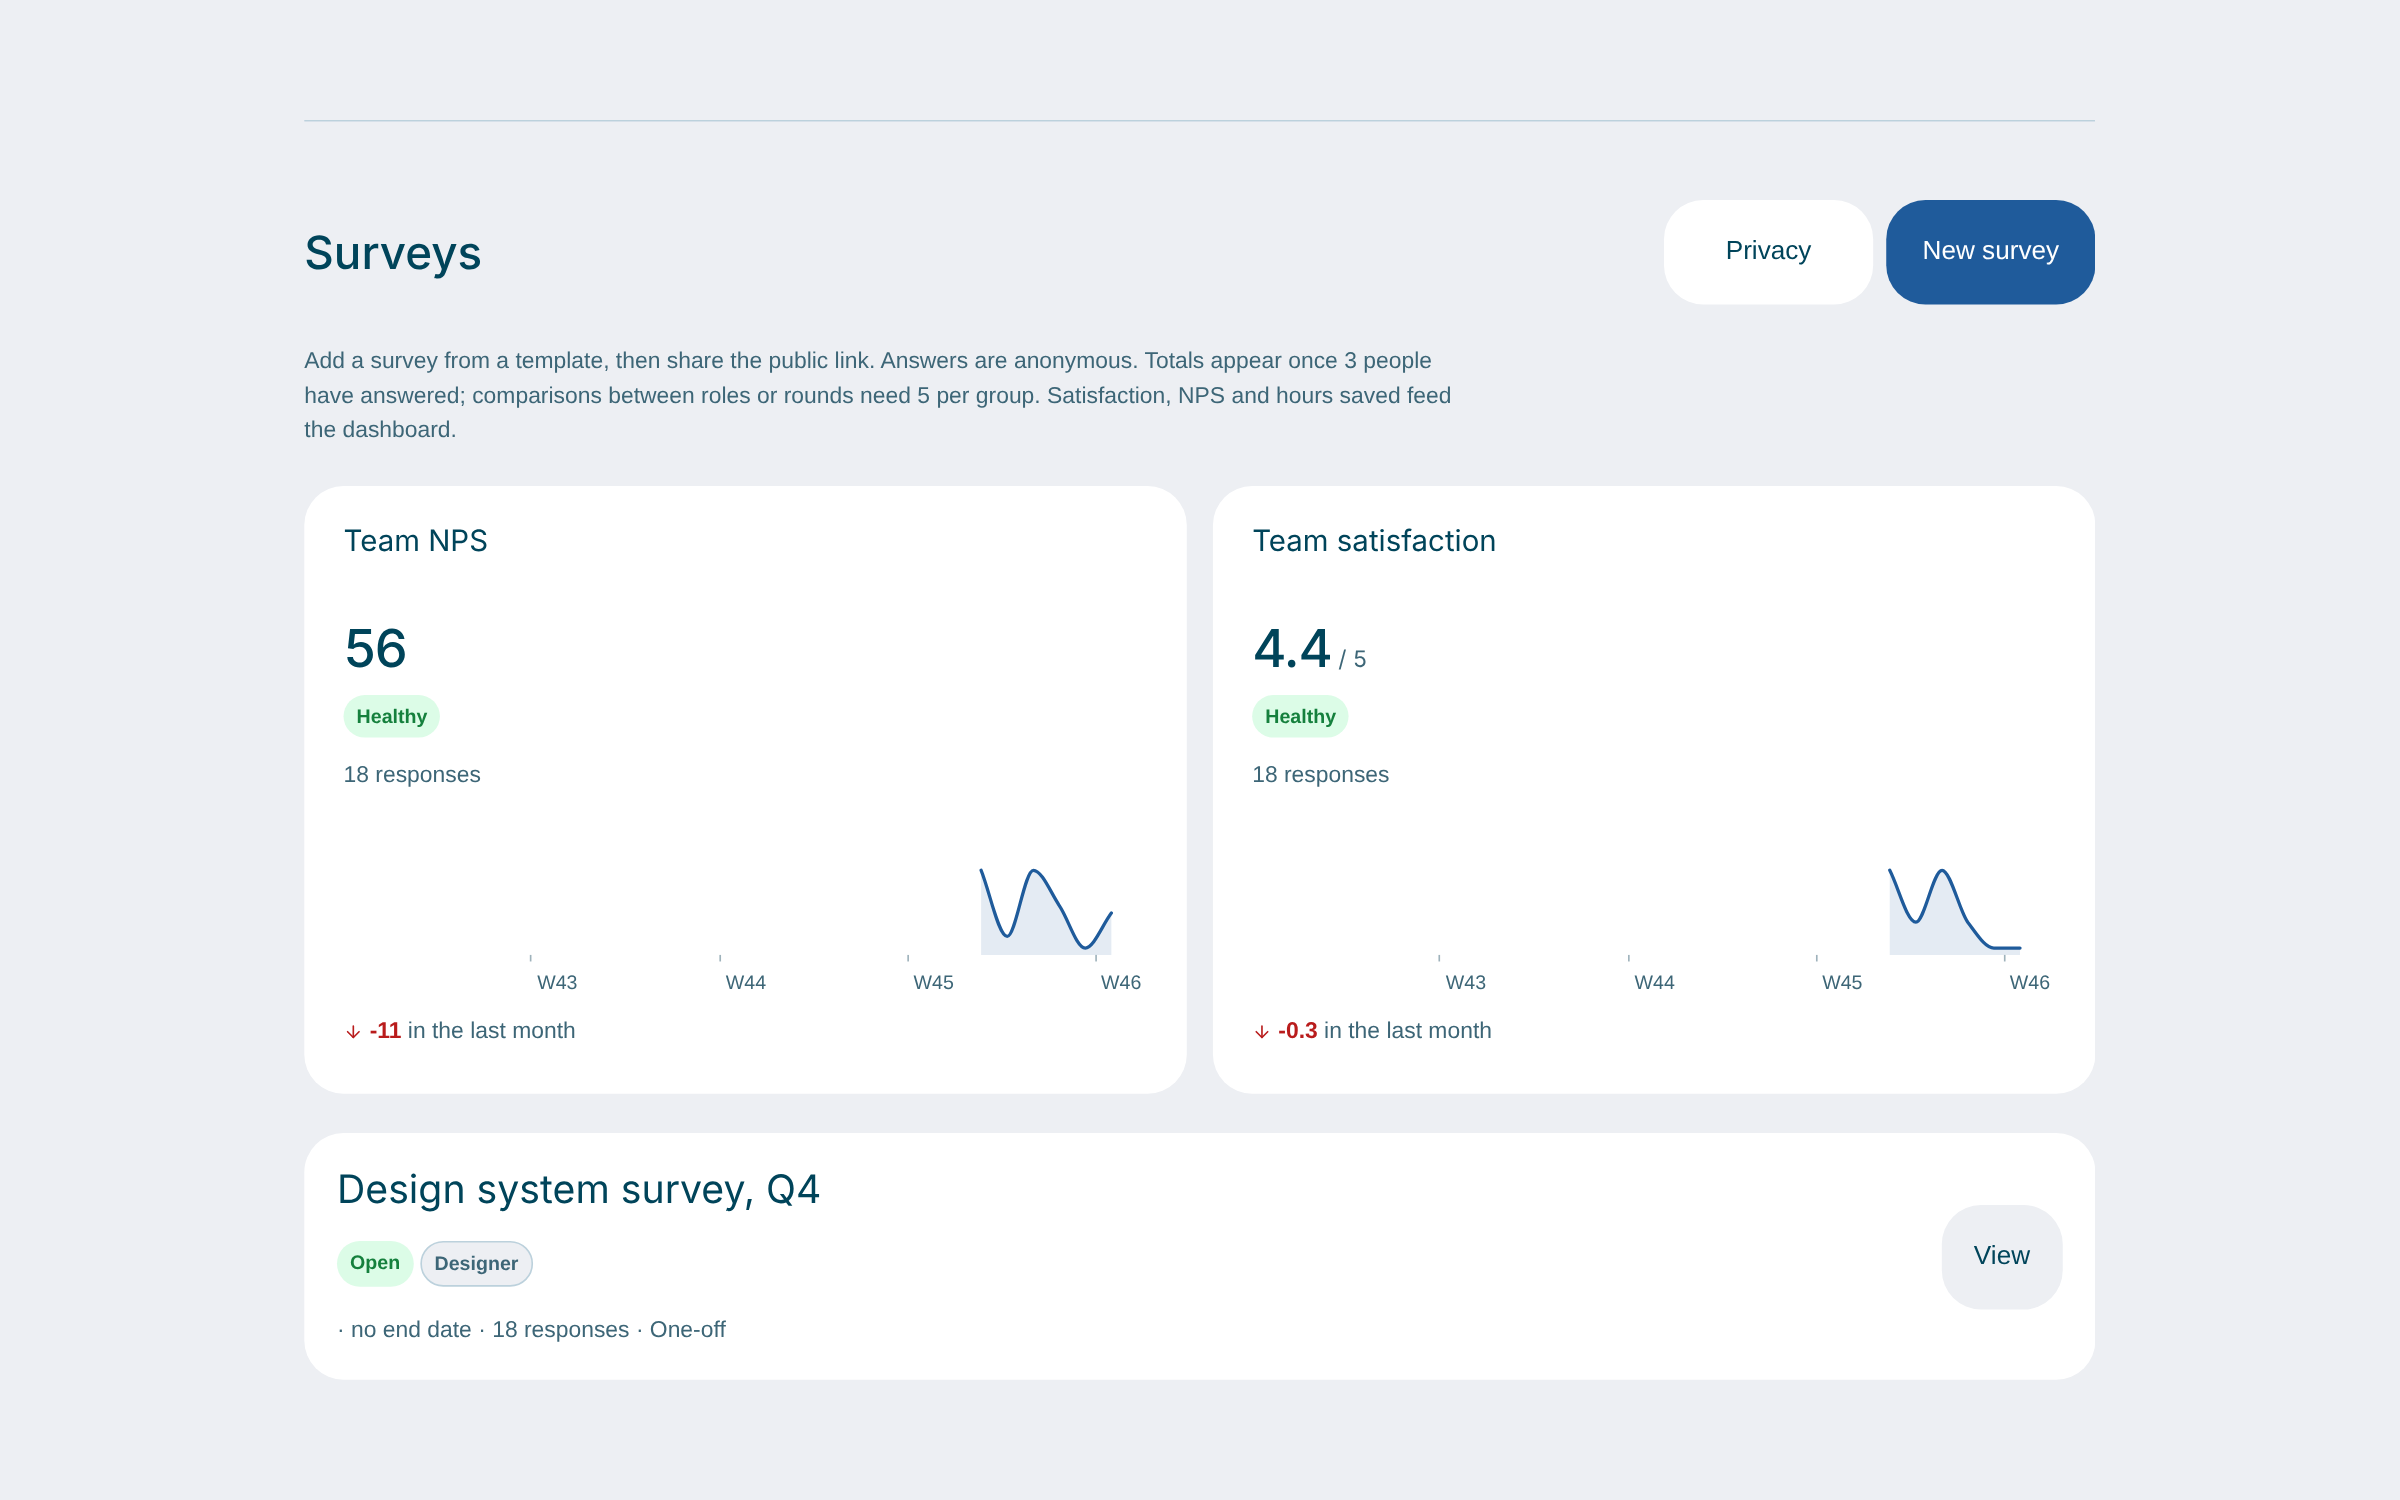
09 / Surveys
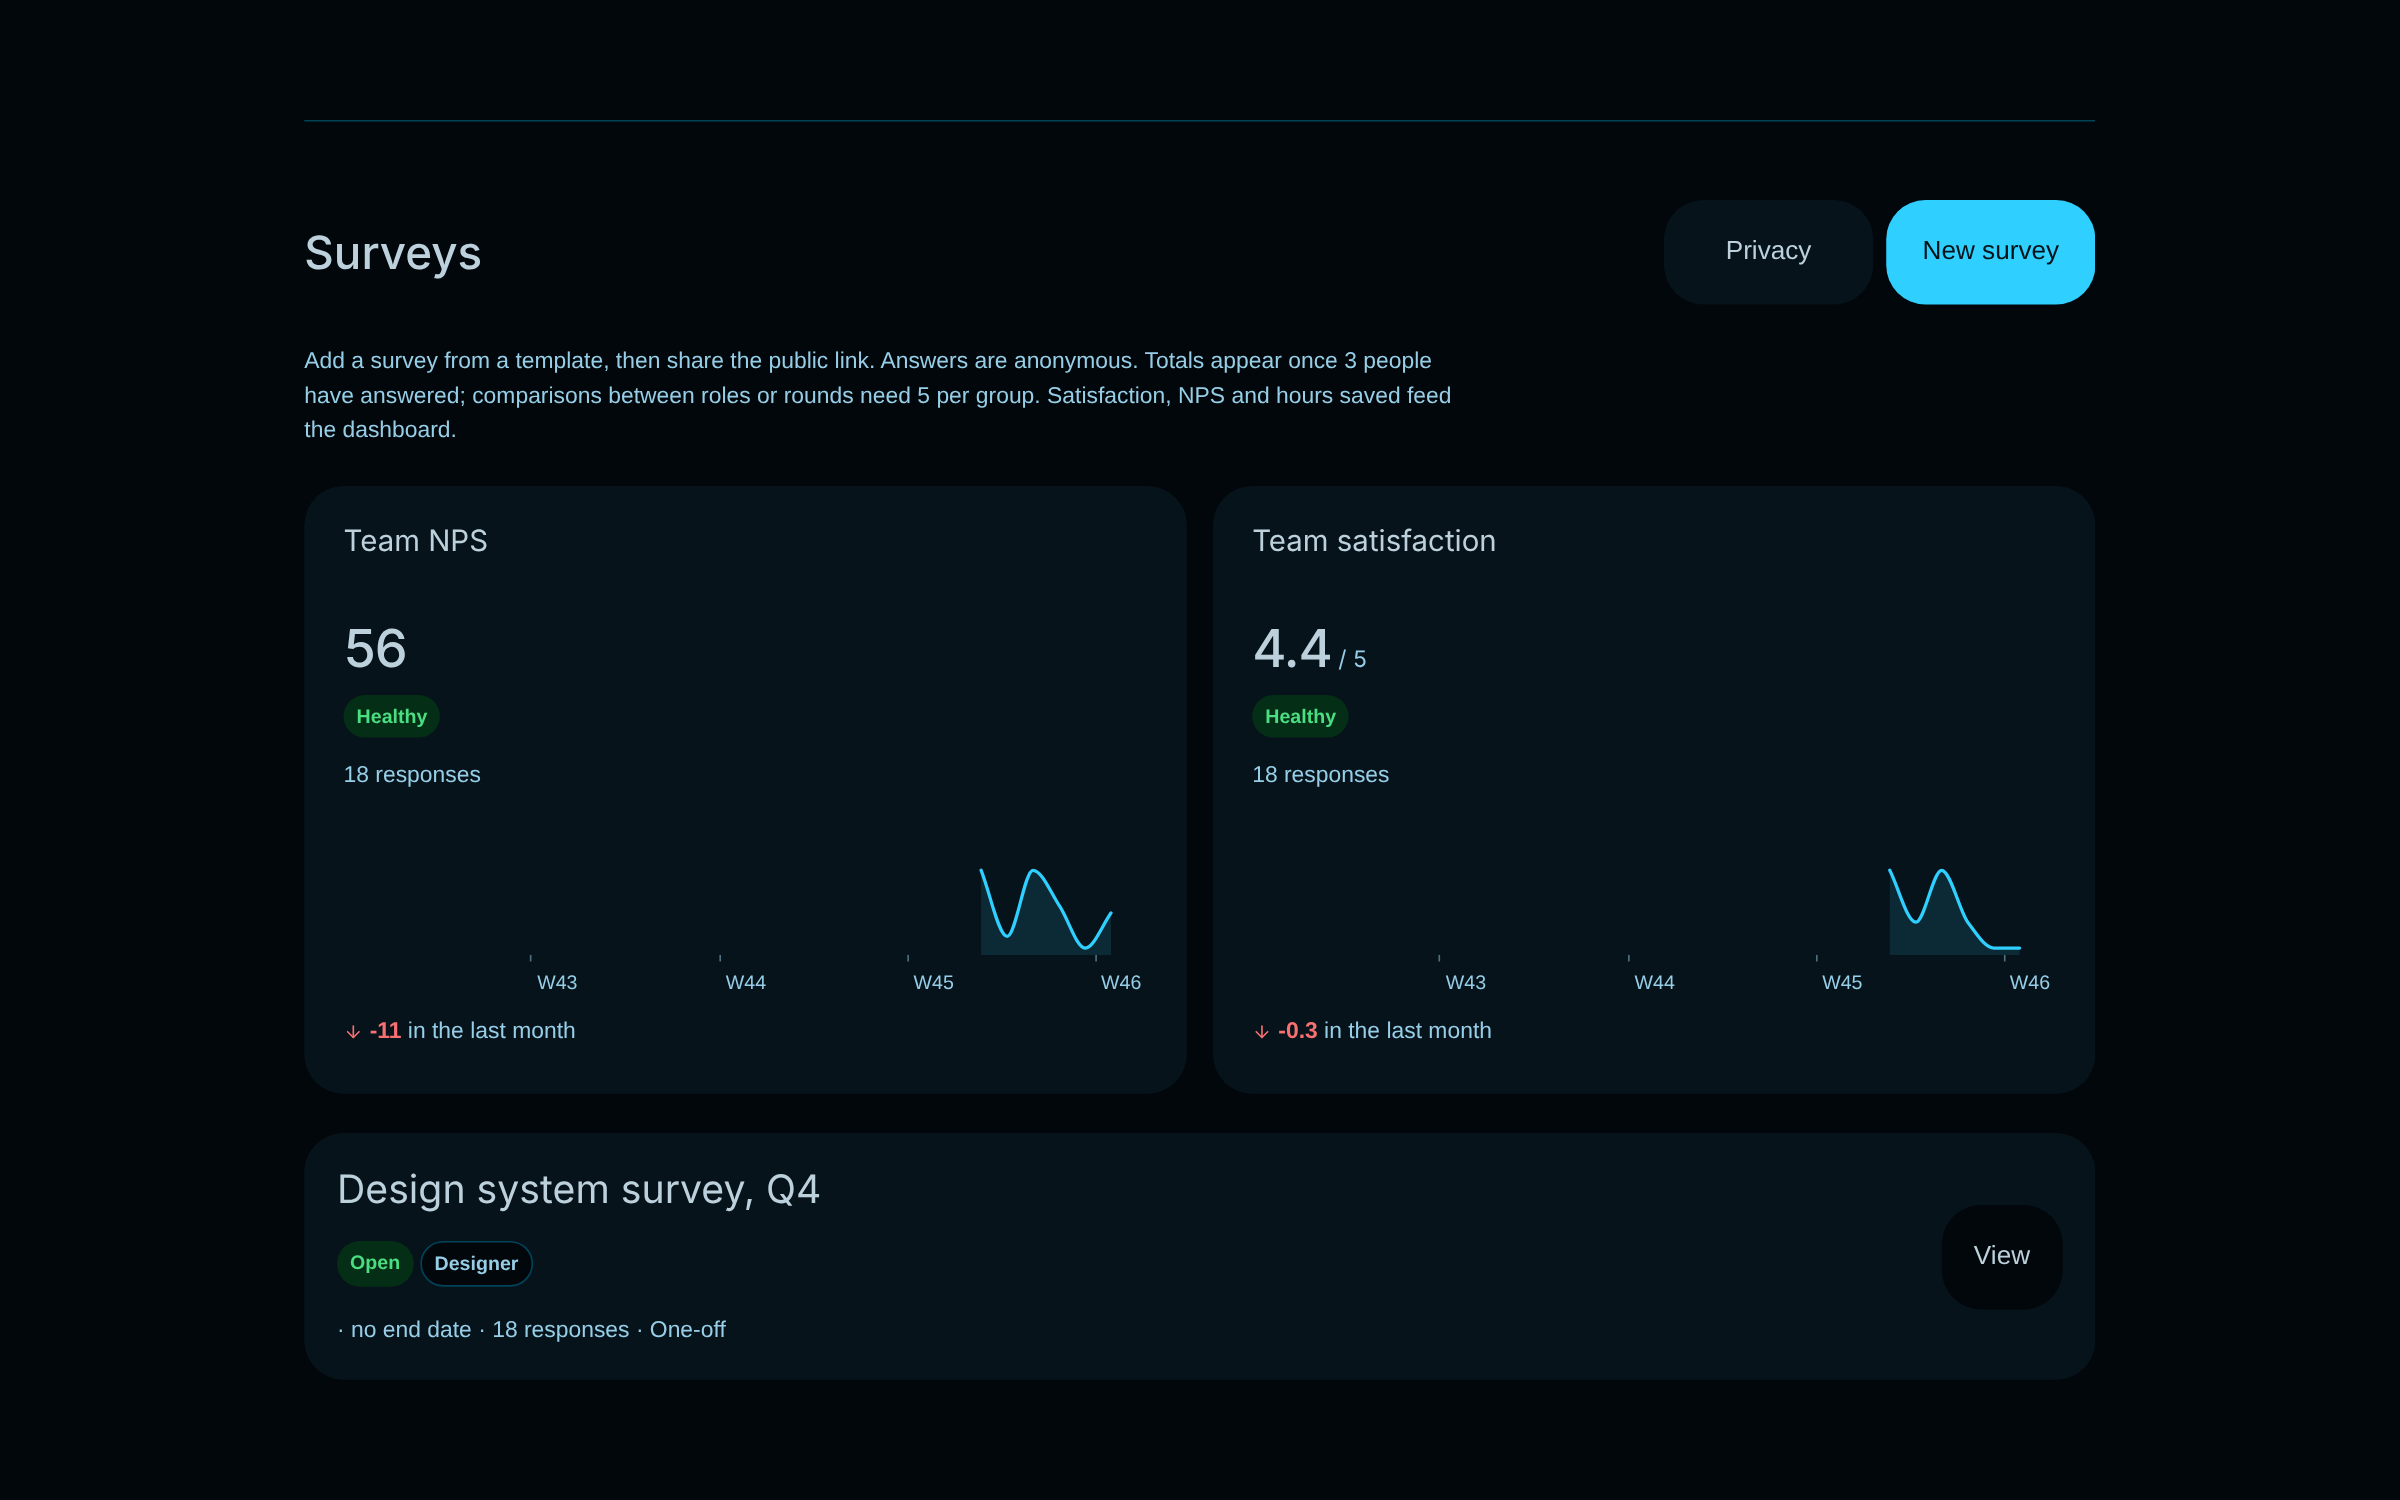
Send an anonymous survey from a template, share the link, and watch team satisfaction, NPS and hours saved appear next to the numbers measured from your code and Figma.
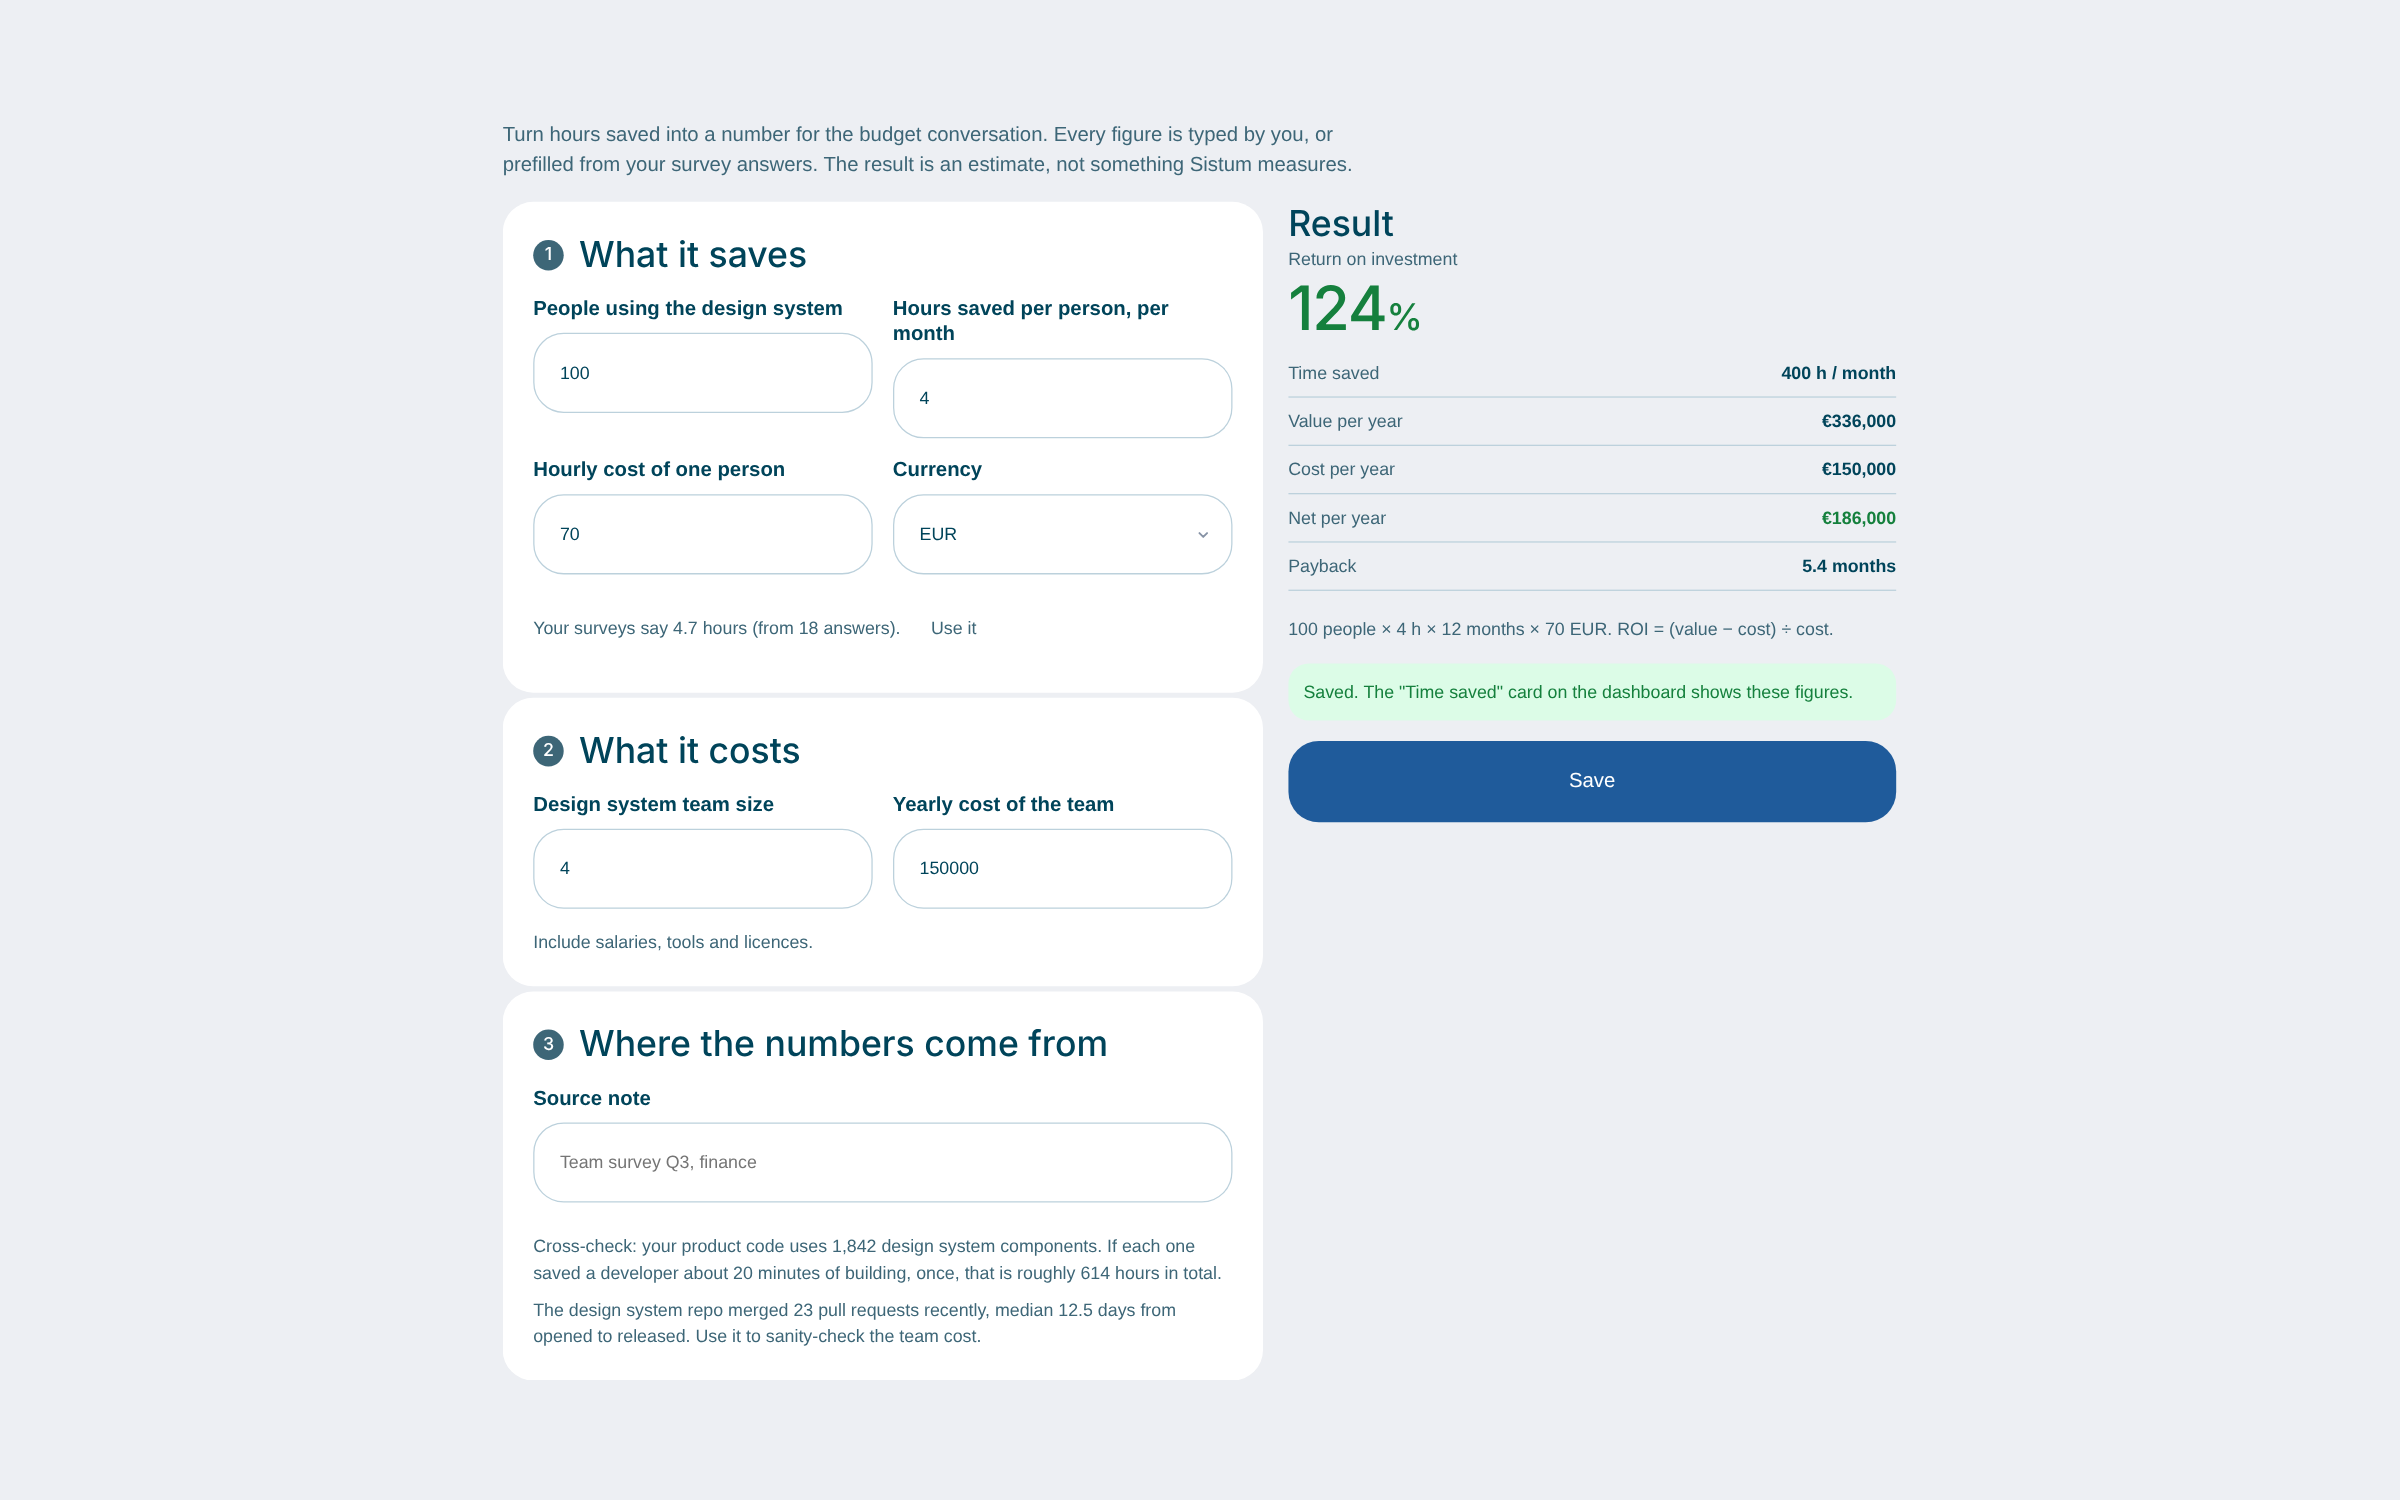
10 / ROI
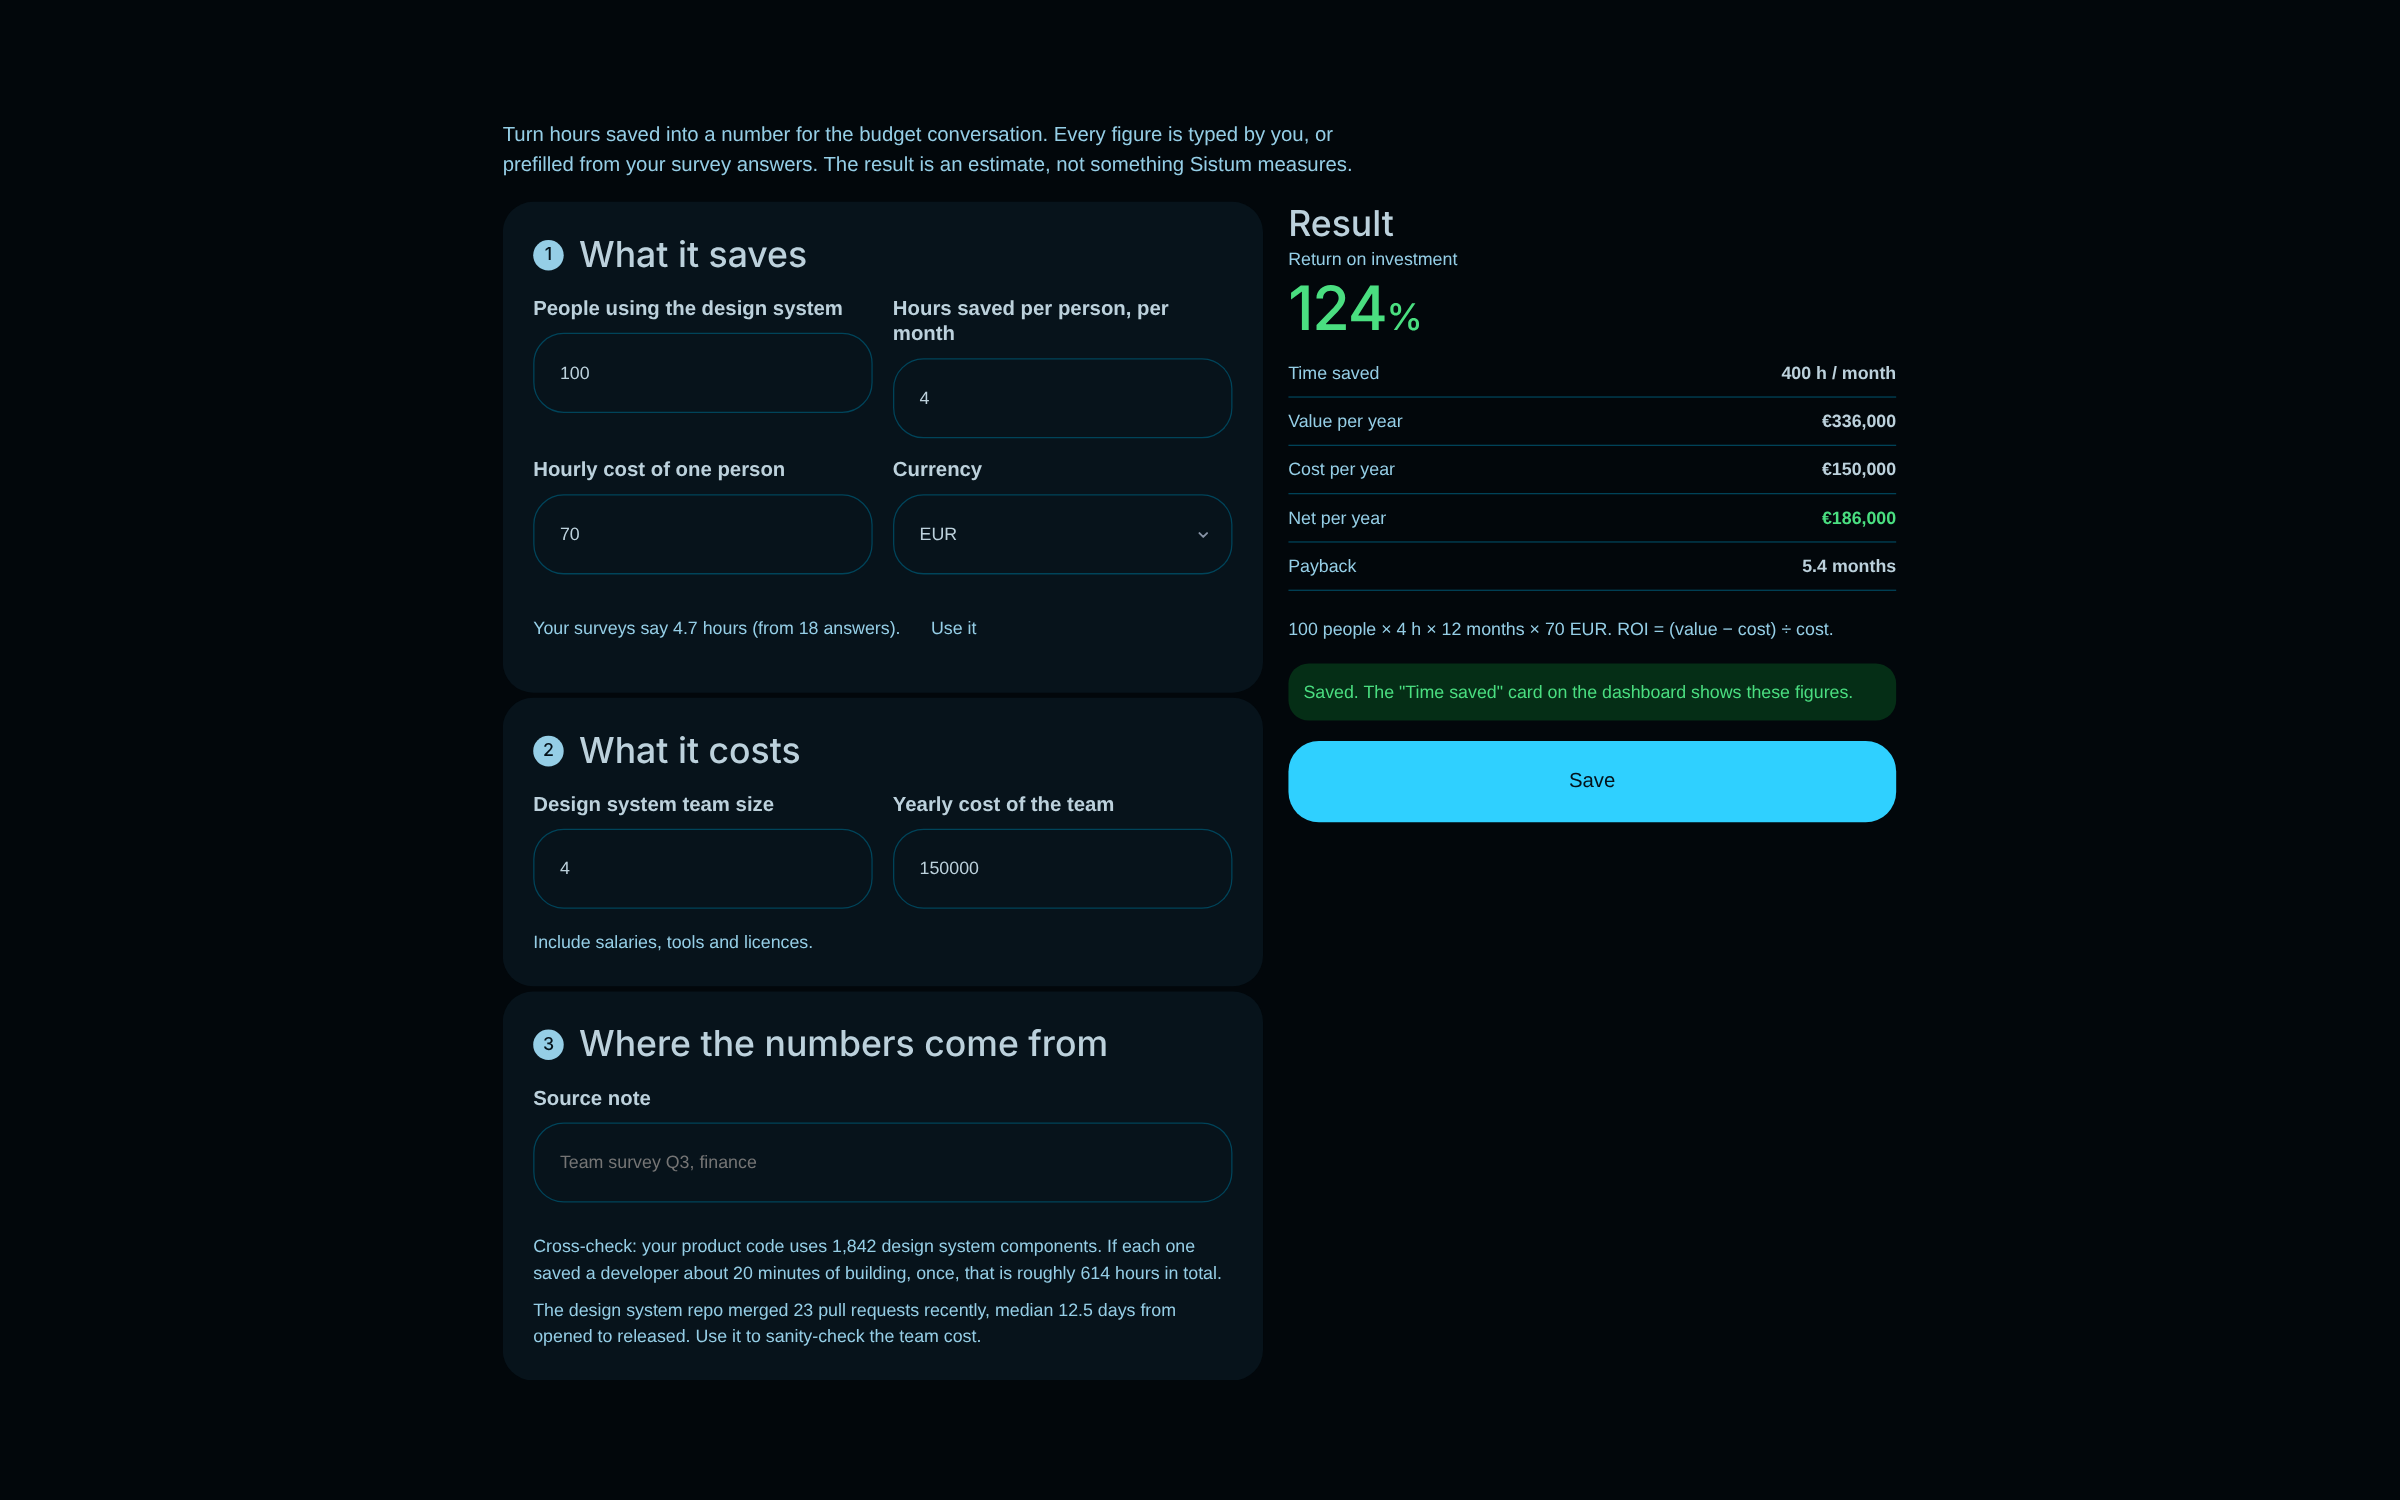
Turn hours saved into money. Enter how many people use the design system, the hours it saves each of them and what the team costs, and Sistum shows the return on investment, the net value per year and the payback time.
Use the app in English or in French.
A GitHub Action and a GitLab CI job that check only the lines a PR adds.
Compare Figma variables with the values in code.
Let scripts and AI agents read your health summary.
A summary of what moved, by email, on the schedule you set.
Download your metrics as CSV or JSON.
A health check for design systems. It reads your Figma libraries and your code, measures how the system is adopted and maintained, and gives you a score, a sentence and a ranked list of what to do next.
Design system teams that report to the rest of the company: managers, leads and the people who maintain the library.
Access to the places your design system lives, such as Figma and the GitHub or GitLab repository. Product repositories, Zeroheight and surveys are optional and unlock more metrics.
Sistum reads files in the repositories you connect to measure usage, props, overrides, releases and issues, and nothing else. The Method page lists every source.
One number from 0 to 100 for the health of a design system: the average of seven vitals. The method is public and versioned, so a score means the same thing wherever you see it.
There is a free plan for one design system. Paid plans add surveys, email digests, the API and more, and their prices will be announced soon.
Yes. Paste a public repository for an instant partial reading. No account is needed.
Beta invitations go out in small groups. Join the waitlist and we will email you when your turn comes.
Beta invitations go out in small groups. Join the waitlist and tell us what you manage.
You are on the list. We will email you when the beta opens.